


- Gold price breakout in consolidation just below resistance - constructive above 1350
- Check out our 2019 projections in our Free DailyFX Gold Trading Forecasts
- Join Michael for Live Weekly Strategy Webinars on Mondays at 12:30GMT
Gold prices are virtually unchanged month-to-date with XAU/USD trading within a broad consolidation pattern just below multi-year highs. These are the updated targets and invalidation levels that matter on the Gold (XAU/USD) weekly price chart. Review my latest Weekly Strategy Webinar for an in-depth breakdown of this gold price setup and more.
New to Gold Trading? Get started with this Free How to Trade Gold -Beginners Guide
Gold Price Chart - XAU/USD Weekly
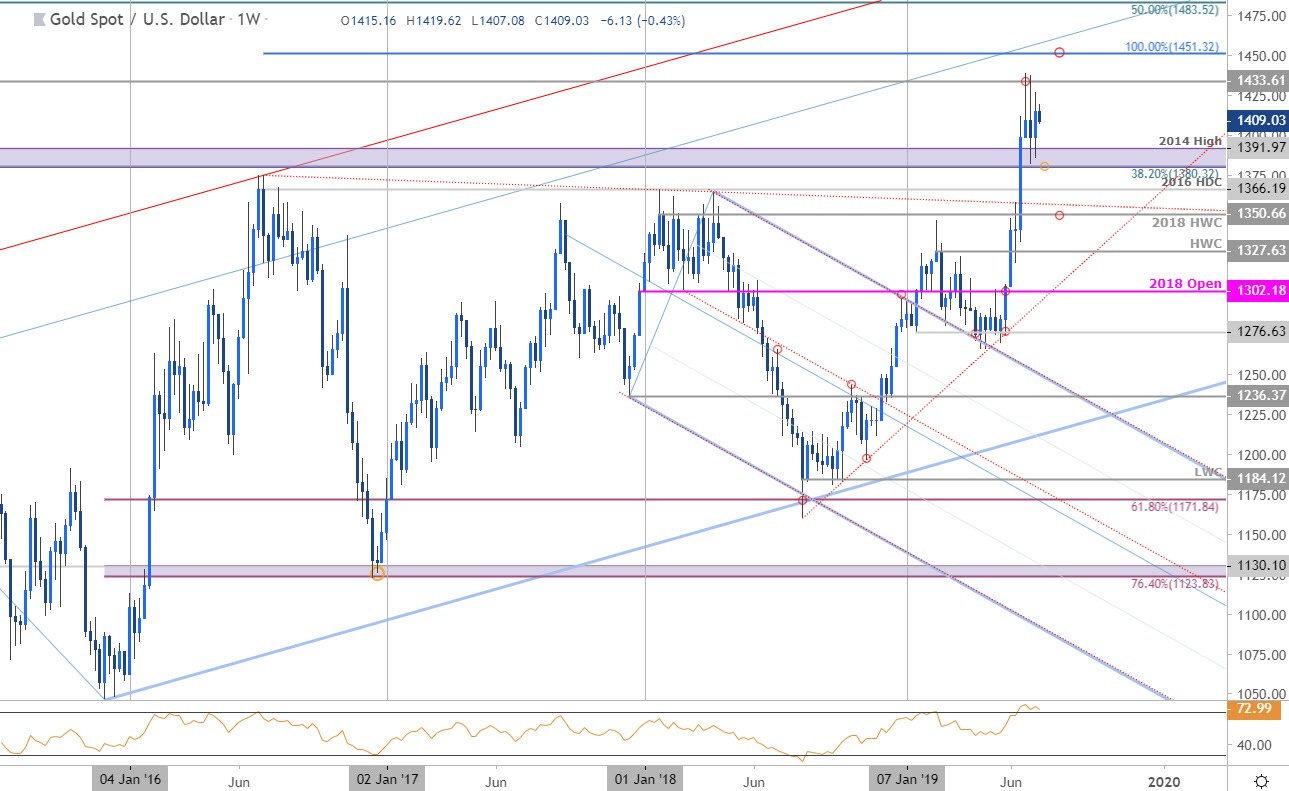
Notes: In my last Gold Price Weekly Outlook we noted that, “While the broader gold price outlook remains constructive on the back of this recent breakout, the immediate advance is at risk heading into the July open- be on the lookout for topside exhaustion.” For the past three weeks gold has been in consolidation (possible pennant formation- typically a continuation pattern) just below the 1433 resistance targets and we’re looking for the break for guidance.
Initial support rests at 1380 backed by 1366 with broader bullish invalidation with the 2018 high-week close at 1350. A topside breach / close above 1433 exposes subsequent resistance targets at the 100% extension at 1451 backed by the 50% retracement of the decline off the record highs at 1483.
For a complete breakdown of Michael’s trading strategy, review his Foundations of Technical Analysis series on Building a Trading Strategy
Bottom line: Gold prices are in a multi-week consolidation pattern just below resistance- look to the break for guidance. From a trading standpoint, the risk remains for a move lower before resumption of the broader uptrend. Be on the lookout for an exhaustion low ahead of 1350 IF price does break this formation lower. Ultimately, we’ll favor fading weakness on a pullback in price targeting a break to new highs. I’ll publish an updated Gold Price Outlook once we get further clarity in near-term price action.
Even the most seasoned traders need a reminder every now and then- Avoid these Mistakes in your trading
Gold Trader Sentiment (XAU/USD)
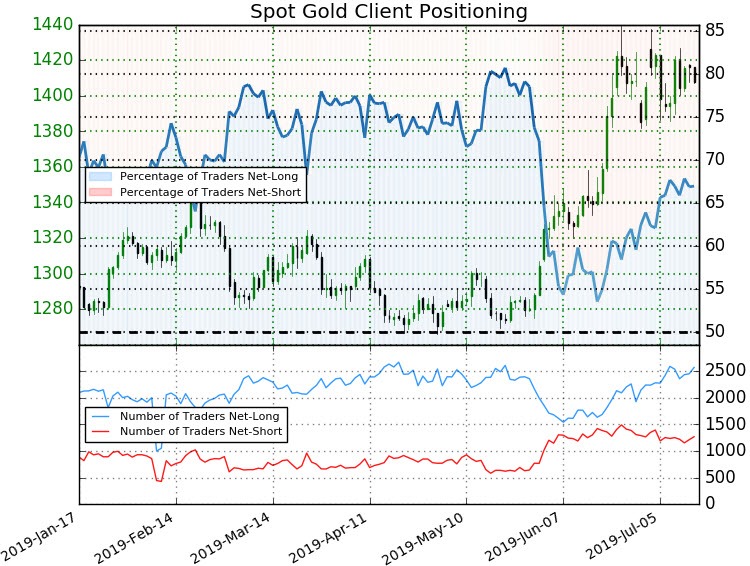
- A summary of IG Client Sentiment shows traders are net-long Gold - the ratio stands at +2.02 (66.9% of traders are long) – bearish reading
- Long positions are 1.1% higher than yesterday and 6.7% higher from last week
- Short positions are 4.4% higher than yesterday and 1.0% lower from last week
- We typically take a contrarian view to crowd sentiment, and the fact traders are net-long suggests Gold prices may continue to fall. Yet, positioning is less net-long than yesterday but more net-long from last week and the combination of current positioning and recent changes gives us a further mixed Spot Gold trading bias from a sentiment standpoint.
See how shifts in Gold retail positioning are impacting trend- Learn more about sentiment!
---
Previous Weekly Technical Charts
Learn how to Trade with Confidence in our Free Trading Guide
--- Written by Michael Boutros, Technical Currency Strategist with DailyFX
Follow Michael on Twitter @MBForex


