


- Updated weekly technicals on Gold (XAU/USD) – price reversal approaching key pivot zone at yearly low
- Check out our 2019 projections in our Free DailyFX Gold Trading Forecasts
- Join Michael for Live Weekly Strategy Webinars on Mondays at 12:30GMT
Gold prices are down more than 4.8% from the February highs with the decline now approaching the yearly range lows. Here are the key targets & invalidation levels that matter on the Gold (XAU/USD) weekly chart this month. Review last week’s Strategy Webinar for an in-depth breakdown of this setup and more.
New to Gold Trading? Get started with this Free How to Trade Gold -Beginners Guide
Gold Weekly Price Chart (XAU/USD)
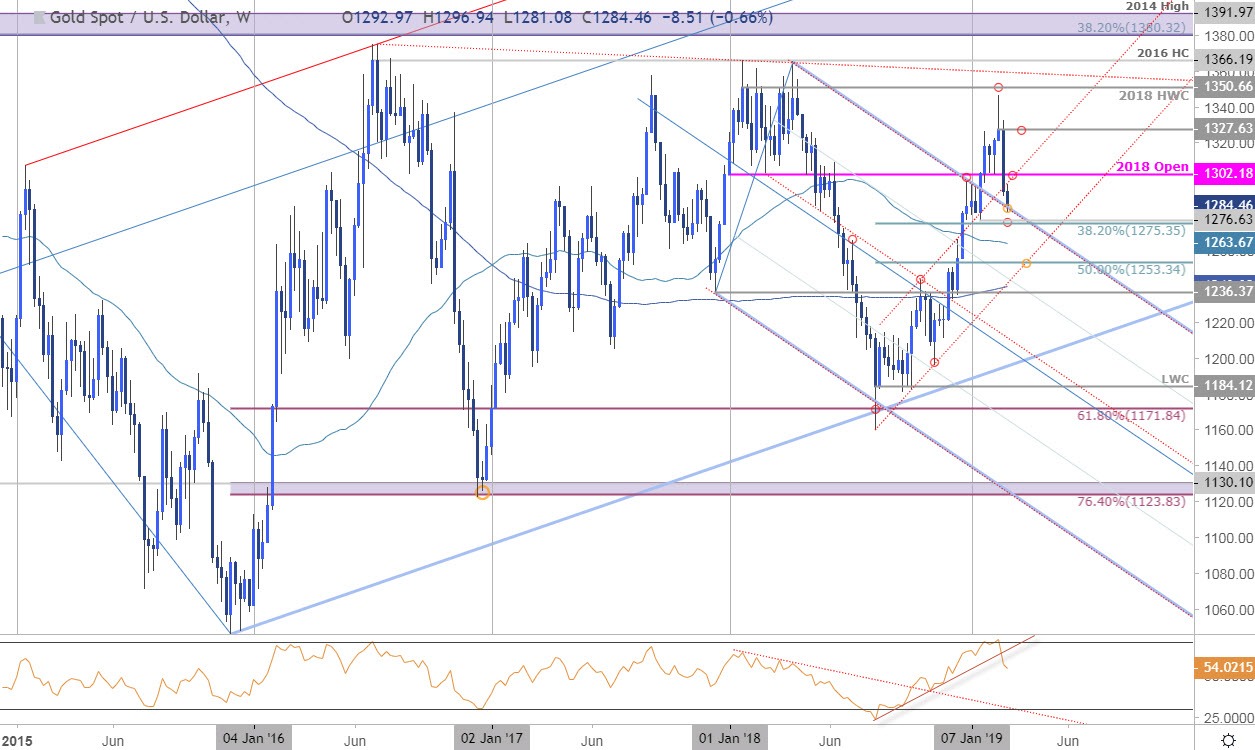
Notes: In my previous Gold Weekly Technical Outlook we noted that, “From a trading standpoint, looking to reduce long-exposure just higher and be on the lookout for near-term exhaustion on a stretch towards 1350.” Price registered a high at 1346 before pulling back with the reversal now testing former pitchfork resistance as support. A more significant support zone is eyed just lower at 1275/76 – a region defined by the 38.2% retracement of the August rally and the objective 2019 opening-range low.
A break below this level would shift the medium-term focus lower in price with such a scenario targeting the 52-week moving average at 1263 backed by 2018 trendline / 50% retracement at 1253 – look for a larger reaction there IF reached. Initial resistance stands at 1302 with a breach / close above the high-week close at 1327 needed to mark resumption of the broader up-trend targeting 1350.
For a complete breakdown of Michael’s trading strategy, review his Foundations of Technical Analysis series on Building a Trading Strategy
Bottom line:The immediate focus is on a reaction lower towards the yearly range lows. From a trading standpoint, a good place to reduce short-exposure / lower protective stops- I’ll be on the lookout for possible exhaustion on a move lower but ultimately the risk remains weighted to the downside sub-1302. Review my latest Gold Price Outlook for a closer look at the near-term trading levels.
Even the most seasoned traders need a reminder every now and then- Avoid these Mistakes in your trading
Gold Trader Sentiment

- A summary of IG Client Sentiment shows traders are net-long Gold - the ratio stands at +3.04 (75.3% of traders are long) – bearish reading
- Long positions are 15.8% higher than yesterday and 5.9% higher from last week
- Short positions are7.7% lower than yesterday and 18.7% lower from last week
- We typically take a contrarian view to crowd sentiment, and the fact traders are net-long suggests Gold prices may continue to fall. Traders are further net-long than yesterday & last week, and the combination of current positioning and recent changes gives us a stronger Gold-bearish contrarian trading bias from a sentiment standpoint.
See how shifts in Gold retail positioning are impacting trend- Learn more about sentiment!
Previous Weekly Technical Charts
- New Zealand Dollar (NZD/USD)
- Crude Oil (WTI)
- Australian Dollar (AUD/USD)
- British Pound (GBP/USD)
- Euro (EUR/USD)
- Japanese Yen (USD/JPY)
- Euro vs Japanese Yen (EUR/JPY)
- Canadian Dollar (USD/CAD)
Learn how to Trade with Confidence in our Free Trading Guide
--- Written by Michael Boutros, Technical Currency Strategist with DailyFX
Follow Michael on Twitter @MBForex


