


- Updated weekly technicals on Crude Oil – risk for larger correction while below 57
- Check out our 2019 projections in our Free DailyFX Crude Oil Trading Forecasts
- Join Michael for Live Weekly Strategy Webinars on Mondays at 12:30GMT
In this series we scale-back and look at the broader technical picture to gain a bit more perspective on where we are in trend. Crude Oil is down more than 2.7% from the weekly open with price now testing key near-term support - here are the key targets & invalidation levels that matter on the WTI weekly chart.
New to Oil Trading? Get started with this Free How to Trade Crude Oil Beginners Guide
Crude Oil Weekly Price Chart (WTI)
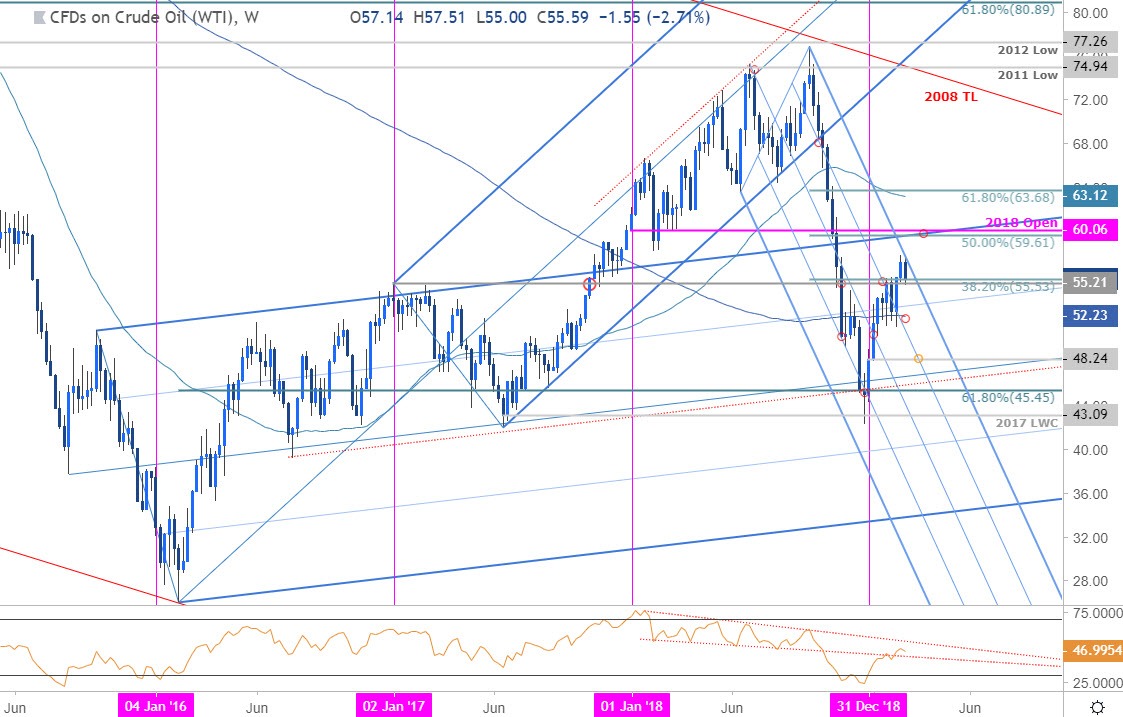
Notes: In last month’s Crude Oil Weekly Technical Outlook our ‘bottom line’ noted that we were, “looking for support on a larger pullback towards the median-line to offer more favorable long-entries with our broader focus weighted to the topside while above 46.91.” Price registered a low at 51.22 before breaking through resistance at the monthly opening-range highs with the advance turning from pitchfork resistance early this week.
Immediate support is eyed here at the 55.21/53 pivot zone- a break / close below would threaten a larger decline targeting the 200-week moving average at ~52.23 with critical support eyed at 48.24. A topside breach of this formation / the high-day close at 57.14 targets more a more significant resistance confluence at 59.61-60.06 where the 50% retracement of the October decline and the 2018 open converge on the 2015/ 2016 pitchfork resistance- look for a larger reaction there IF reached. A weekly close above would be needed to suggest that a more meaningful low was registered in December with such a scenario targeting the 52-week moving average / 61.8% retracement at 63.13/68.
For a complete breakdown of Michael’s trading strategy, review his Foundations of Technical Analysis series on Building a Trading Strategy
Bottom line: Crude oil prices have turned from slope resistance and the focus is on a reaction this week at the 52.21/53 pivot zone. From a trading standpoint, a break below this level would heighten the risk for further losses but ultimately, a larger correction may offer more favorable long-entries with a breach above pitchfork resistance needed to fuel the next leg higher in crude prices. I’ll publish an updated Crude Oil Technical Outlook once we get further clarity on near-term price action.
Even the most seasoned traders need a reminder every now and then- Avoid these Mistakes in your trading
Crude Oil Trader Sentiment

- A summary of IG Client Sentiment shows traders are net-long crude oil - the ratio stands at +2.08 (67.5% of traders are long) – bearishreading
- Traders have remained net-long since October 11th; price has moved 21.2% lower since then
- Long positions are14.8% higher than yesterday and 9.8% higher from last week
- Short positions are 15.0% lower than yesterday and 25.9% lower from last week
- We typically take a contrarian view to crowd sentiment, and the fact traders are net-long suggests crude oil prices may continue to fall. Traders are further net-long than yesterday & last week, and the combination of current positioning and recent changes gives us a stronger crude oil-bearish contrarian trading bias from a sentiment standpoint.
See how shifts in Crude Oil retail positioning are impacting trend- Learn more about sentiment!
Previous Weekly Technical Charts
- Australian Dollar (AUD/USD)
- Gold (XAU/USD)
- British Pound (GBP/USD)
- Euro (EUR/USD)
- Japanese Yen (USD/JPY)
- Euro vs Japanese Yen (EUR/JPY)
- Canadian Dollar (USD/CAD)
- New Zealand Dollar (NZD/USD)
Learn how to Trade with Confidence in our Free Trading Guide
--- Written by Michael Boutros, Technical Currency Strategist with DailyFX
Follow Michael on Twitter @MBForex


