


- Gold clears January opening-range highs– risk for pullback but constructive above 1280
- Check out our 2019 projections in our Free DailyFX Gold Trading Forecasts
- Join Michael for Live Weekly Strategy Webinars on Mondays at 12:30GMT
Gold prices broke above technical resistance last week and while the broader focus in price remains weighted to the topside, the advance is approaching levels which may limit the rally near-term. These are the updated targets and invalidation levels that matter on the XAU/USD charts.
New to Gold Trading? Get started with this Free How to Trade Gold -Beginners Guide
Gold Daily Price Chart (XAU/USD)
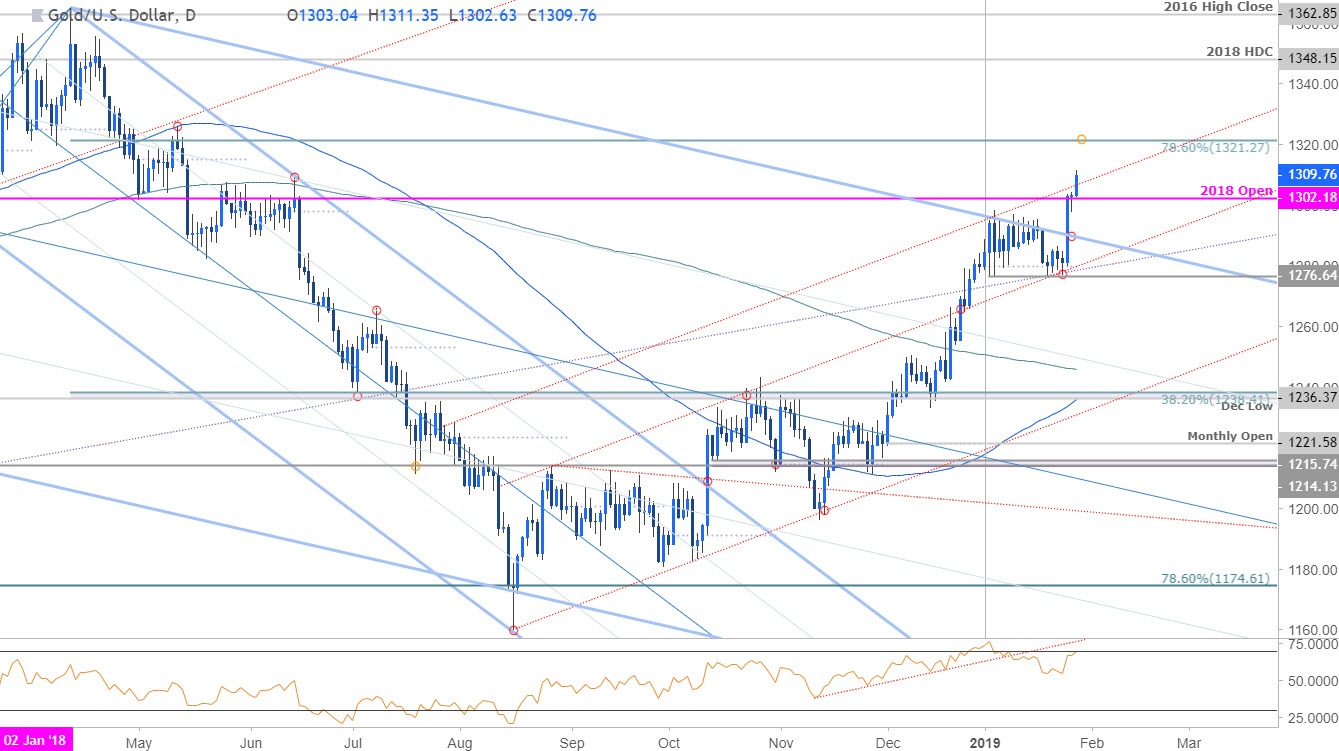
Technical Outlook: In my latest Gold Weekly Technical Outlook we note that the rally was approaching the first major threshold of resistance with, “a close above the 2018 open at 1302 to validate a larger breakout in price.” Price broke above the January opening-range on Friday with the advance taking bullion through 1302 early in the week.
The focus is on a daily close above this parallel (red) with subsequent resistance objectives eyed at the 78.6% retracement of the 2018 range at 1321. Initial support rests at former slope resistance (currently ~1286) with broader bullish invalidation at the monthly range lows at 1276.
Why does the average trader lose? Avoid these Mistakes in your trading
Gold 120min Price Chart (XAU/USD)
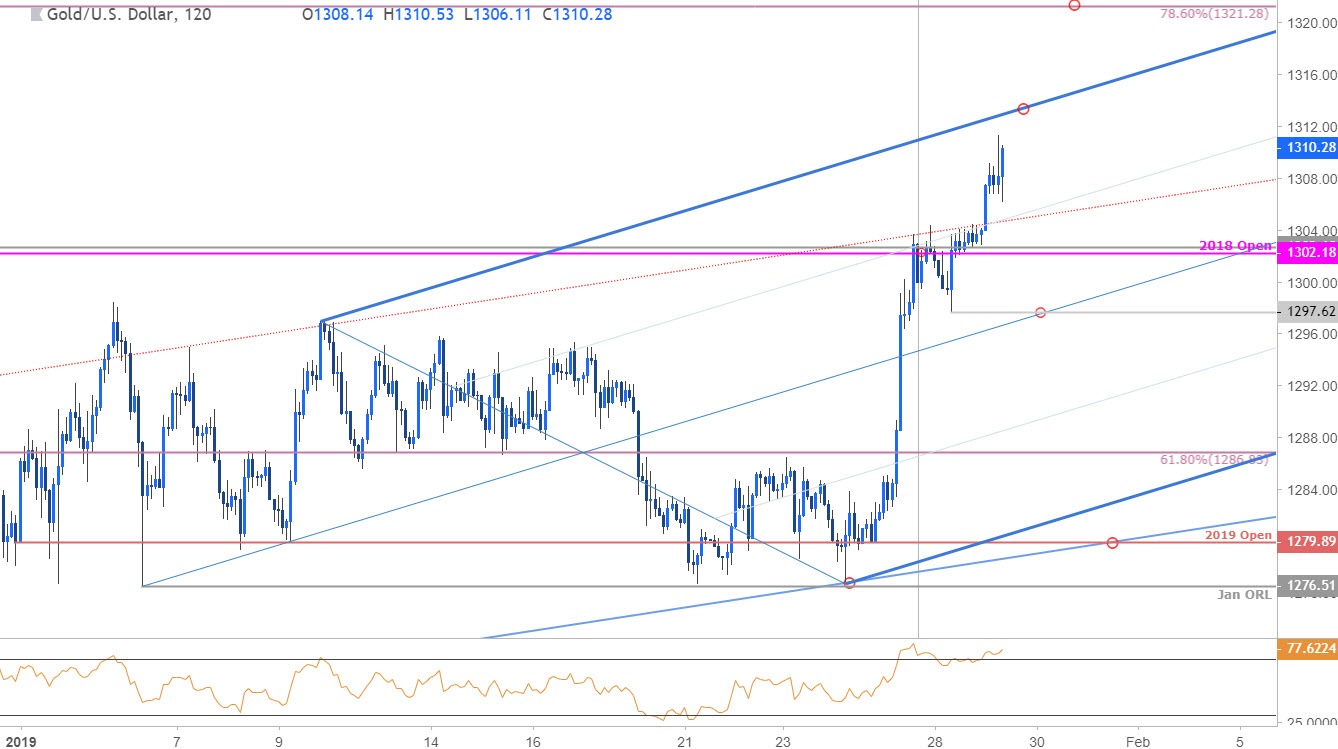
Notes: A closer look at price action shows gold trading within the confines of an ascending pitchfork formation extending off the January lows with bullion trading just below the upper median-line parallel around ~1313 today in New York trade (blue). The advance is at risk near-term heading into this region with initial support back at the weekly open at 1302. Near-term bullish invalidation rests at 1297- weakness beyond this zone would suggest a larger correction is underway with such a scenario exposing 1286.
Learn how to Trade with Confidence in our Free Trading Guide
Bottom line: While our broader outlook remains weighted to the topside, the immediate gold advance may be vulnerable heading into near-term slope resistance. From a trading standpoint, look for possible price exhaustion at these levels with a pullback to offer more favorable long-entries while within this ascending formation, ultimately targeting a breach higher. Keep in mind the FOMC interest rate decision is on tap tomorrow with Non-Farm Payrolls (NFP) slated for Friday- expect volatility.
For a complete breakdown of Michael’s trading strategy, review his Foundations of Technical Analysis series on Building a Trading Strategy
Gold Trader Sentiment
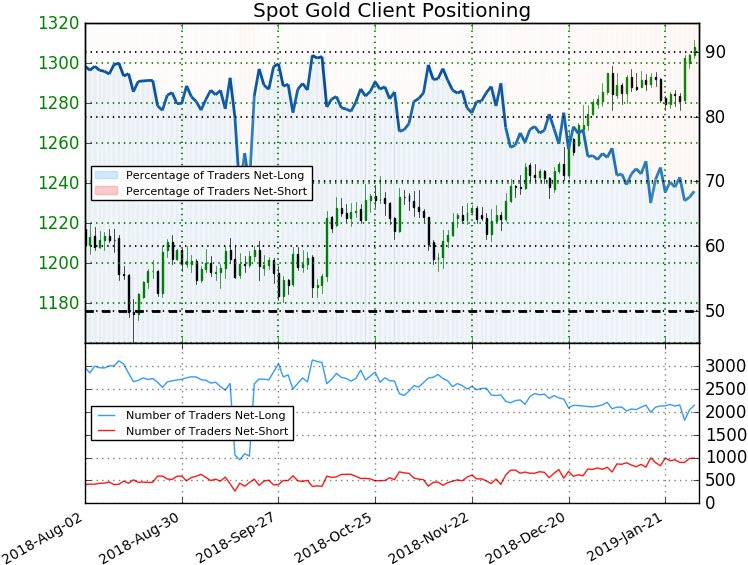
- A summary of IG Client Sentiment shows traders are net-long Gold - the ratio stands at +2.17 (68.5% of traders are long) – bearishreading
- Long positions are6.6% higher than yesterday and 0.2% lower from last week
- Short positions are 2.3% higher than yesterday and 0.4% lower from last week
- We typically take a contrarian view to crowd sentiment, and the fact traders are net-long suggests Gold prices may continue to fall. Traders are further net-long than yesterday & last week, and the combination of current positioning and recent changes gives us a stronger Gold-bearish contrarian trading bias from a sentiment standpoint.
See how shifts in Gold retail positioning are impacting trend- Learn more about sentiment!
---
Active Trade Setups
- Crude Oil Technical Price Outlook: WTI Pullback Testing Pivot Support
- AUD/USD Technical Price Outlook: Aussie Recovery Losing Steam
- GBP/USD Price Outlook: Pound Testing Key Resistance Amid Brexit Talks
- EUR/USD Technical Price Outlook: Euro Testing Lower Bounds of Support
- Written by Michael Boutros, Currency Strategist with DailyFX
Follow Michael on Twitter @MBForex


