


- Updated weekly technicals on Crude Oil (WTI)- Price sell-off testing first major support hurdle
- Check out our 4Q projections in our Free DailyFX Crude Oil Trading Forecasts
- Join Michael for Live Weekly Strategy Webinars on Mondays at 12:30GMT
In this series we scale-back and take a look at the broader technical picture to gain a bit more perspective on where we are in trend. Oil prices have continued to plummet with crude attempting its sixth consecutive weekly decline into a critical support confluence at the yearly lows. Here are the key targets & invalidation levels that matter on the Crude Oil (WTI) weekly chart. Review this week’s Strategy Webinar for an in-depth breakdown of this setup and more.
New to Oil Trading? Get started with this Free How to Trade Crude Oil Beginners Guide
Crude Oil Weekly Price Chart (WTI)
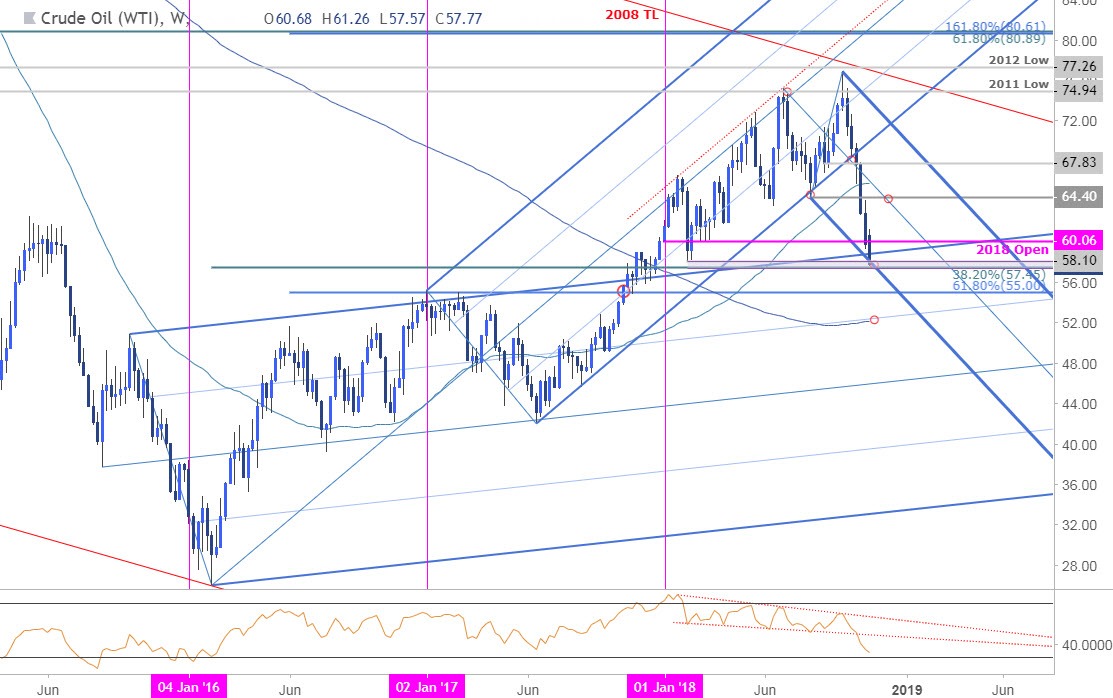
Notes: In last month’s Crude Oil Weekly Technical Perspective we highlighted a critical support confluence at the lower bounds of a multi-year formation in price around 67.83. A break lower in late-October has fueled a decline of more than 23% from the yearly highs with price now targeting the next major support hurdle at 57.45-58.10 – a region defined by the 38.2% retracement of the 2016 advance, the 2018 opening-range low and the lower parallel of the descending pitchfork extending off the yearly highs.
The focus is on this critical range with the immediate short-bias at risk near-term while above 57.45. Initial resistance stands at the yearly open at 60.06 backed by the median-line / August low at 64.40 (near-term bearish invalidation). A break / close lower from here risks accelerated losses in crude prices with such a scenario targeting the 55-handle backed by the 200-week moving average around ~52.25.
For a complete breakdown of Michael’s trading strategy, review his Foundations of Technical Analysis series on Building a Trading Strategy
Bottom line:Crude Oil is approaching the first major support confluence at 57.45-58.10. We’re looking for a reaction here with a break / close below targeting subsequent objectives towards the 200-week moving average. From a trading standpoint, a good spot to reduce short exposure / lower protective stop – be on the lookout for a possible near-term exhaustion low. That said, this is a make-or-break level for crude at downtrend support; watch the weekly close for guidance. I’ll publish an updated Crude Oil Scalp Report once we get further clarity on near-term price action.
Even the most seasoned traders need a reminder every now and then- Avoid these Mistakes in your trading
Crude Oil Trader Sentiment

- A summary of IG Client Sentiment shows traders are net-long Crude Oil - the ratio stands at +5.21 (83.9% of traders are long) – bearish reading
- Traders have remained net-long since October 11th; price has moved 20.2% lower since then
- Long positions are3.5% higher than yesterday and 18.1% higher from last week
- Short positions are 14.0% higher than yesterday and 19.6% higher from last week
- We typically take a contrarian view to crowd sentiment, and the fact traders are net-long suggests Crude Oilprices may continue to fall. Yet traders are less net-long than yesterday & compared with last week and the recent changes in sentiment warn that the current Crude Oil price trend may soon reverse higher despite the fact traders remain net-long.
See how shifts in Crude Oil retail positioning are impacting trend- Learn more about sentiment!
Previous Weekly Technical Charts
- New Zealand Dollar (NZD/USD)
- Gold (XAU/USD)
- Australian Dollar (AUD/USD)
- Euro (EUR/USD)
- US Dollar Index (DXY)
- Canadian Dollar (USD/CAD)
Learn how to Trade with Confidence in our Free Trading Guide
--- Written by Michael Boutros, Technical Currency Strategist with DailyFX
Follow Michael on Twitter @MBForex or contact him at mboutros@dailyfx.com


