


- Updated weekly technicals for USD/JPY- price testing yearly range resistance at 113.27
- Check out our 3Q projections in our Free DailyFX USD/JPY Trading Forecasts
- Join Michael for Live Weekly Strategy Webinars on Mondays at 12:30GMT
In this series we scale-back and take a look at the broader technical picture to gain a bit more perspective on where we are in trend. The Japanese Yen is trading just below yearly range resistance with the FOMC interest rate decision on tap this week. Here are the key targets & invalidation levels that matter on the USD/JPY weekly chart. Review this week’s Strategy Webinar for an in-depth breakdown of this setup and more.
New to Forex Trading? Get started with this Free Beginners Guide
USD/JPY Weekly Price Chart

Notes: The yen has been under pressure for the last three weeks with USD/JPY approaching a key resistance range at 112.65-113.27. This region is defined by the 2018 open, the 200-week moving average and the 61.8% retracement of the 2017 decline. Note that this zone stands just pips from the objective yearly opening-range highs at 113.38.
A breach above this threshold targets subsequent topside resistance objectives at 115.31 and the 2017 open at 116.98. Initial weekly support stands at the 52-week moving average / former trendline resistance at ~110.40 with a break below 109.92 needed to suggest that a larger price reversal is underway.
For a complete breakdown of Michael’s trading strategy, review his Foundations of Technical Analysis series on Building a Trading Strategy
Bottom line: The USD/JPY rally remains vulnerable heading into this key resistance range. From a trading standpoint, the near-term opportunity may be to fade against this threshold but we’ll need some convincing price action to warrant such a trade. A weekly close above would be needed to validate the breakout but for now, I’m looking for exhaustion.
Even the most seasoned traders need a reminder every now and then- Avoid these Mistakes in your trading
USD/JPY Trader Sentiment

- A summary of IG Client Sentiment shows traders are net-short USD/JPY - the ratio stands at -1.23 (44.8% of traders are long) – weak bullishreading
- Traders have remained net-short since September 13th; price has moved 1.1% higher since then
- Long positions are10.3% higher than yesterday and 63.4% higher from last week
- Short positions are 5.3% higher than yesterday and 45.9% higher from last week
- We typically take a contrarian view to crowd sentiment, and the fact traders are net-short suggests USDJPY prices may continue to rise. Yet traders are less net-short than yesterday and compared with last week. Recent changes in sentiment warn that the current USDJPY price trend may soon reverse lower despite the fact traders remain net-short.
See how shifts in USD/JPY retail positioning are impacting trend- Learn more about sentiment!
Relevant USD/JPY Data Releases
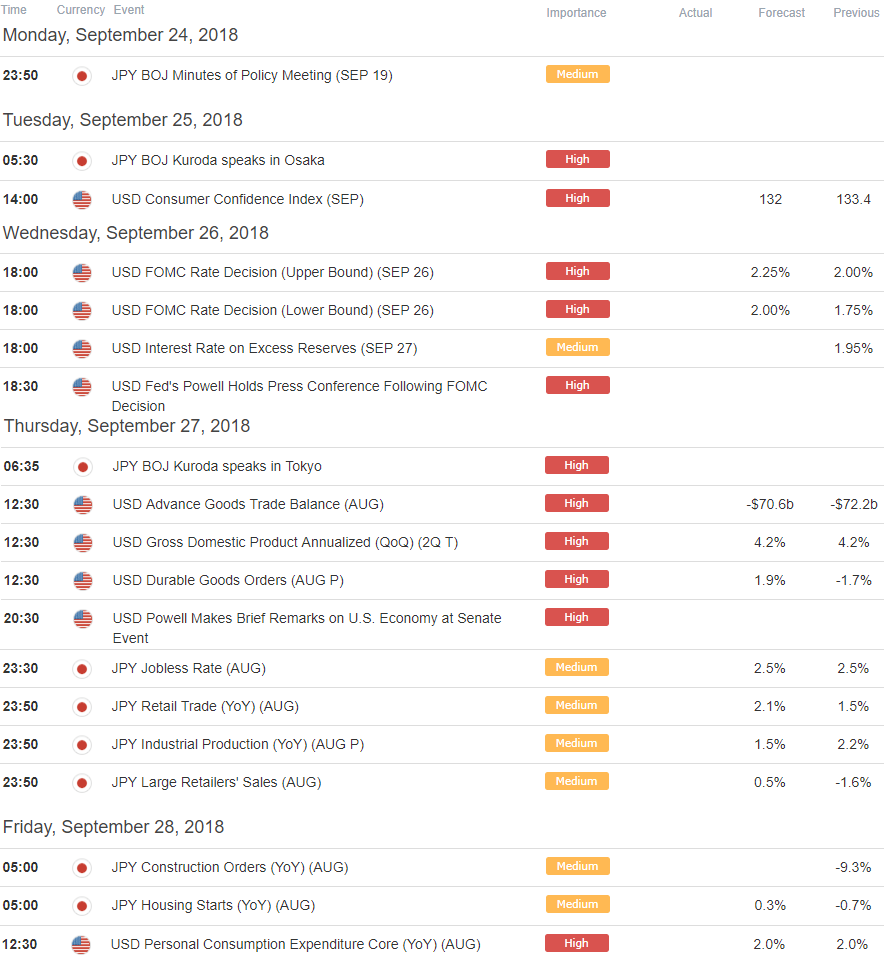
Economic Calendar – for the latest economic developments and upcoming event risk
Previous Weekly Technical Perspectives
Learn how to Trade with Confidence in our Free Trading Guide
--- Written by Michael Boutros, Technical Currency Strategist with DailyFX
Follow Michael on Twitter @MBForex or contact him at mboutros@dailyfx.com


