


- Gold price reversal off slope support in focus- rally remains constructive above 1180
- Check out our 3Q projections in our Free DailyFX Gold Trading Forecasts
- Join Michael for Live Weekly Strategy Webinars on Mondays at 12:30GMT
Gold prices have rebounded more than 3% off the yearly lows registered last week with the advance looking a bit vulnerable just ahead of structural resistance. Here are the updated targets and invalidation levels that matter on the XAU/USD charts heading into the close of the week. Review this week’s Strategy Webinar for an in-depth breakdown of this setup and more.
Gold Daily Price Chart
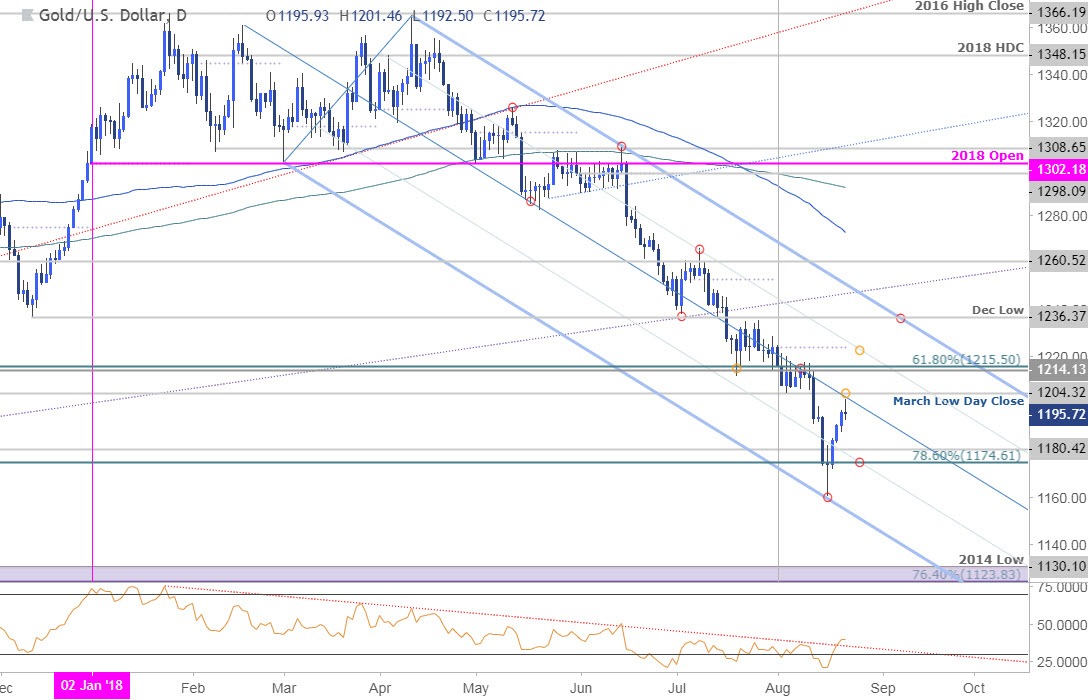
Technical Outlook: In our last Gold Technical Outlook we noted that price had, “responded to down-trend support and threatens a larger recovery - a close above 1180 would bode well for a near-term rebound… From a trading standpoint, reduce / close short-exposure here – be on the lookout for evidence of price exhaustion.” Gold closed at 1184 the following day, keeping our focus weighted to the topside into the close of the week. Note that an RSI resistance trigger dating back to the January highs broke this week and offers further conviction on the long-side of gold prices.
In last week’s Gold Forecast, we noted that, “Weekly resistance now stands at 1204/09 with a breach above the median-line needed to suggest a more significant low is in place.” Price registered a high today at 1201 before pulling back and while the broader focus remains higher, the advance remains vulnerable near-term. Interim support rests at 1180 with bullish invalidation now raised to 1174.
New to Forex Trading? Get started with this Free Beginners Guide
Gold 240min Price Chart
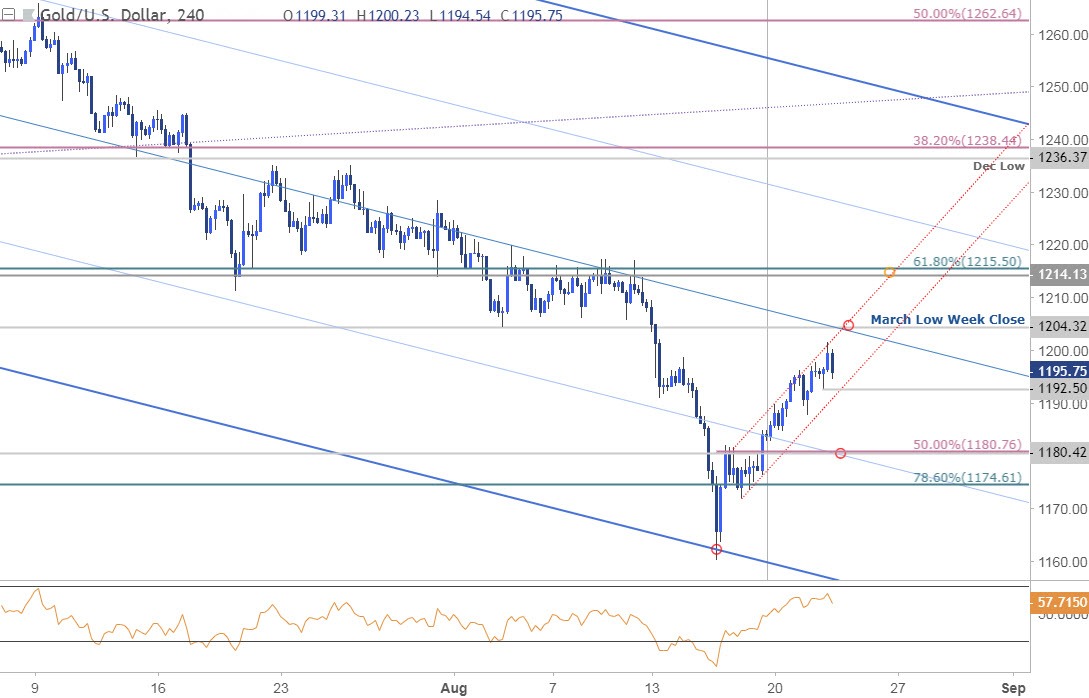
Notes: A closer look at gold price action highlights last week’s reversal off slope support with the advance trading within the confines of a tight channel off the Friday low. Interim support rests at 1192- a break there would leave prices vulnerable to a larger pullback towards 1180 (looking for exhaustion / long-entries in such a scenario). A topside breach above the March low-day close at 1204 targets 1214/15 backed by the upper 50-line, currently around ~1225.
Why does the average trader lose? Avoid these Mistakes in your trading
Bottom line: The rebound in gold is looking a bit vulnerable here near-term but IF prices are indeed heading higher (favored), pullbacks should be limited to the weekly open. From a trading standpoint, I’ll favor fading weakness while above 1180 with a breach / close above 1215 needed to fuel the next leg higher in gold prices.
For a complete breakdown of Michael’s trading strategy, review his Foundations of Technical Analysis series on Building a Trading Strategy
Spot Gold Trader Sentiment

- A summary of IG Client Sentiment shows traders are net-long Gold - the ratio stands at +5.68 (85.0% of traders are long) – bearishreading
- Long positions are1.1% lower than yesterday and 10.5% lower from last week
- Short positions are 0.4% higher than yesterday and 4.0% lower from last week
- We typically take a contrarian view to crowd sentiment, and the fact traders are net-long suggests Spot Gold prices may continue to fall. Yet traders are less net-long than yesterday and compared with last week. Recent changes in sentiment warn that the current Spot Gold price trend may soon reverse higher despite the fact traders remain net-long.
See how shifts in Gold retail positioning are impacting trend- Learn more about sentiment!
---
Economic Calendar - latest economic developments and upcoming event risk. Learn more about how we Trade the News in our Free Guide !
Other Trade Setups in Play
- EUR/USD Price Outlook: Euro Constructive Above 1.14
- AUD/USD Price Outlook: Aussie Recovery Faces Major Resistance Hurdle
- USD/CHF Price Outlook: Pending Swissy Technical Breakout
- Crude Oil Price Analysis: Sell-off Approaching Key Support Targets
- USD/JPY Price Analysis: Yen Strength Pulls Back, But Door Remains Open
- Written by Michael Boutros, Currency Strategist with DailyFX
Follow Michael on Twitter @MBForex or contact him at mboutros@dailyfx.com


