


- A look at the weekly technicals for the Japanese Yen (USD/JPY)- price breakout targets
- Check out our new 3Q USD/JPY price projections in our Free DailyFX Trading Forecasts
- Join Michael for Live Weekly Strategy Webinars on Mondays at 12:30GMT
In this series we scale-back and take a look at the broader technical picture to gain a bit more perspective on where we are in trend. Here are the key targets & invalidation levels that matter on the USD/JPY weekly chart. Review this week’s Strategy Webinar for an in-depth breakdown of this setup and more.
New to Forex Trading? Get started with this Free Beginners Guide
USD/JPY Weekly Price Chart
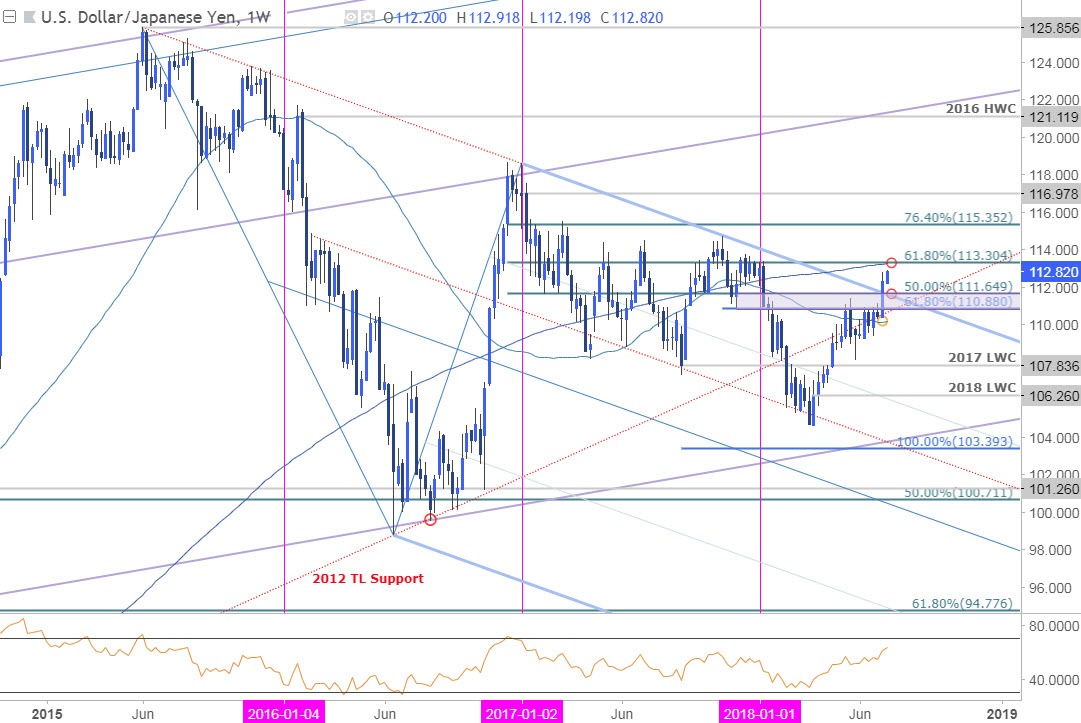
Notes: For months now we’ve highlighted a critical resistance range in USD/JPY, “at 110.88-111.65- a region defined by the 61.8% retracement of the November sell-off and the 50% of the broader decline off the late-2016 high.” Price closed above this threshold last week and leaves the risk for a late-month high in USD/JPY.
That said, price is now testing yearly open resistance with the next major resistance target eyed at 113.20/30 where the 200-week moving average converges on the key 61.8% Fibonacci retracement of the late-2016 decline- look for a reaction there. Interim support now 111.65 with bullish invalidation back at 110.88.
For a complete breakdown of Michael’s trading strategy, review his Foundations of Technical Analysis series on Building a Trading Strategy
Bottom line: We’re checking yearly open resistance today and could get some kickback but the focus remains weighted to the topside towards confluence resistance just above the 113-handle. From a trading standpoint, look to reduce long-exposure heading into this regions and be on the lookout for possible near-term exhaustion short-entries late in the month. I’ll publish an updated USD/JPY scalp report in the days ahead once we get some more structure in near-term price-action after this breakout.
Even the most seasoned traders need a reminder every now and then- Avoid these Mistakes in your trading
USD/JPY Trader Positioning
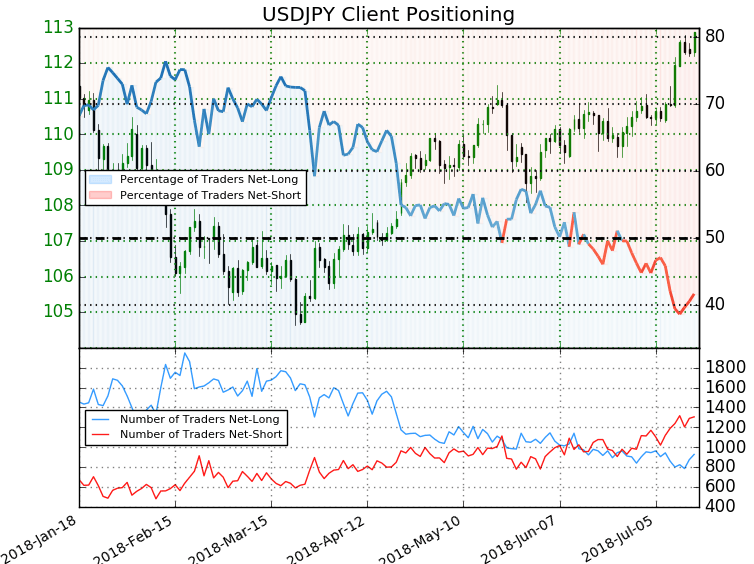
- A summary of IG Client Sentiment shows traders are net-short USD/JPY - the ratio stands at -1.4 (41.6% of traders are long) – weak bullish reading
- Traders have remained net-short since June 28th; price has moved 2.6% higher since then
- Long positions are 5.3% higher than yesterday and 1.0% lower from last week
- Short positions are1.4% higher than yesterday and 10.1% higher from last week
- We typically take a contrarian view to crowd sentiment, and the fact traders are net-short suggests USD/JPY prices may continue to rise. Traders are less net-short than yesterday but more net-short from last week. The combination of current positioning and recent changes gives us a further mixed USD/JPY trading bias from a sentiment standpoint.
See how shifts in retail USD/JPY positioning are impacting trend- Learn more about sentiment!
Relevant USD/JPY Data Releases
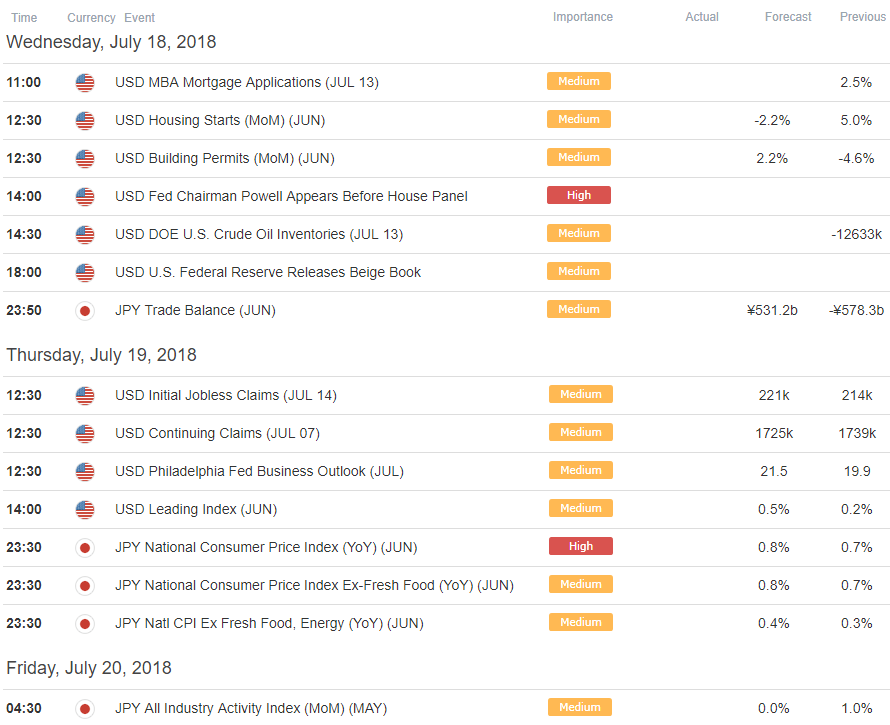
Economic Calendar – for the latest economic developments and upcoming event risk
Previous Weekly Technical Perspectives
- Crude Oil Prices (WTI)
- Euro (EUR/USD)
- British Pound (GBP/USD)
- Australian Dollar (AUD/USD)
- Canadian Dollar (USD/CAD)
- US Dollar (DXY)
--- Written by Michael Boutros, Technical Currency Strategist with DailyFX
Follow Michael on Twitter @MBForex or contact him at mboutros@dailyfx.com


