


- Ethereum price reversal under review – rally approaching initial resistance targets
- Check out our 2018projections in our Free DailyFX Trading Forecasts
- Join Michael for Live Weekly Strategy Webinars on Mondays at 12:30GMT
Ethereum prices are up more than 15% off the June low with the advance now approaching multi-month slope resistance. The near-term technical outlook leaves room for further advances but ultimately a breach above the monthly open would be needed to suggest a larger turn is underway. Here are the key levels that matter for ETH/USD.
New to Trading? Get started with this Free Beginners Guide
Ethereum Daily Price Chart (ETH/USD - Log)
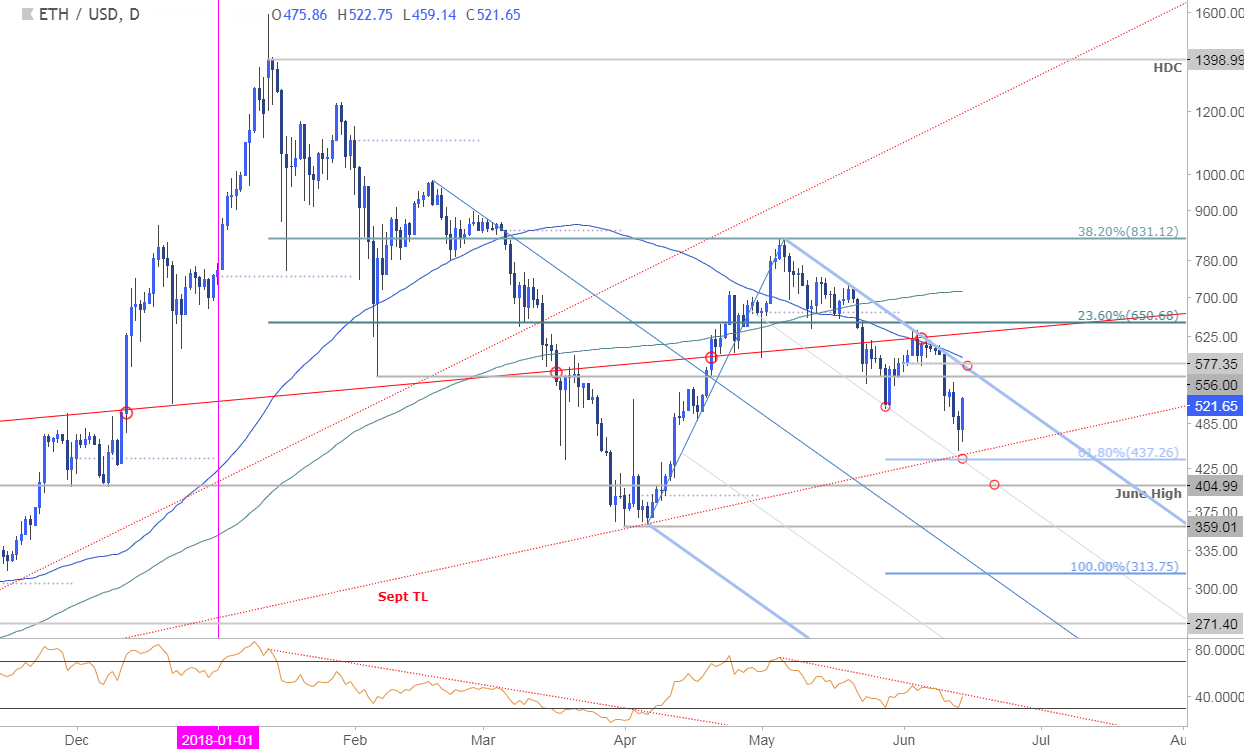
Notes: Ethereum prices turned just ahead of confluence support this week at 437 where the 61.8% extension of the May decline converges on trendline support extending off the September low. Price has continued to trade within the confines of a descending pitchfork formation extending off the February high with the 50-line further highlighting this support zone.
Initial resistance stands at 556 and is backed closely by 577/87 where the monthly open and the 200-day moving average converging on the upper parallel- a breach there is needed to suggest a more significant low is in. Note the pending resistance trigger on the daily RSI profile.
For a complete breakdown of Michael’s trading strategy, review his Foundations of Technical Analysis series on Building a Trading Strategy
Bottom line: We’re looking for resistance just higher on this rebound with the broader risk weighted to the downside while below the monthly open.
Ethereum IG Client Positioning (ETH/USD)
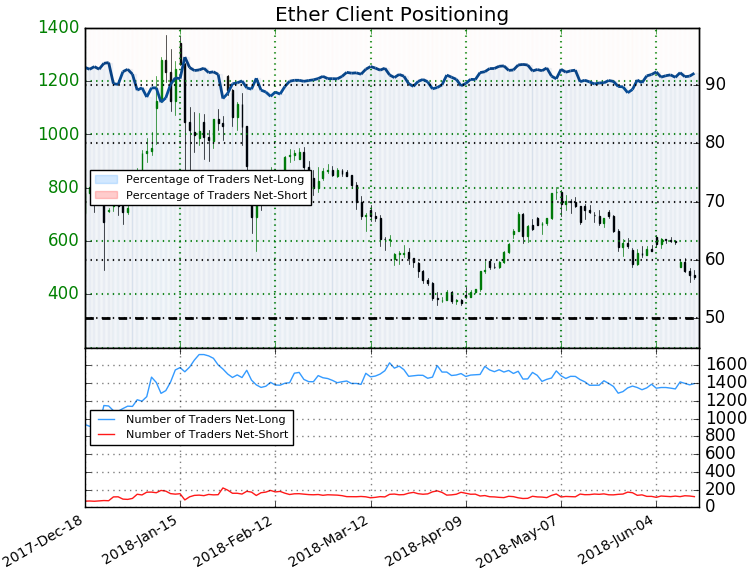
- A summary of IG Client Sentiment shows traders are net-long ETH/USD- the ratio stands at +11.52 (92.0% of traders are long) – bearish reading
- Long positions are 0.9% higher than yesterday and 2.7% higher from last week
- Short positions are 6.9% lower than yesterday and 4.3% higher from last week
- We typically take a contrarian view to crowd sentiment, and the fact traders are net-long suggests Ether prices may continue to fall. Yet traders are more net-long than yesterday but less net-long from last week andthe combination of current positioning and recent changes gives us a further mixed Ether trading bias from a sentiment standpoint.
Even the most seasoned traders need a reminder every now and then- Avoid these Mistakes in your trading
Other Setups in Play:
--- Written by Michael Boutros, Technical Currency Strategist with DailyFX
Follow Michael on Twitter @MBForex or contact him at mboutros@dailyfx.com


