


- A look at the weekly technicals on EUR/USD, AUD/USD and GBP/JPY
- Review Michael’s Foundations of Technical Analysis Series on Building a Trade Strategy
- Join Michael for Live Weekly Strategy Webinars on Mondays at 12:30GMT
In this series we scale-back and take a look at the broader technical picture to gain a bit more perspective on where we are in trend. Here are the key levels that matter on the weekly charts for the EUR/USD, AUD/USD and GBP/JPY. Review this week’s Strategy Webinar for an in-depth breakdown of these setups and more.
Check out our New 2018 projectionsin our Free DailyFX Trading Forecasts
EUR/USD Weekly Price Chart
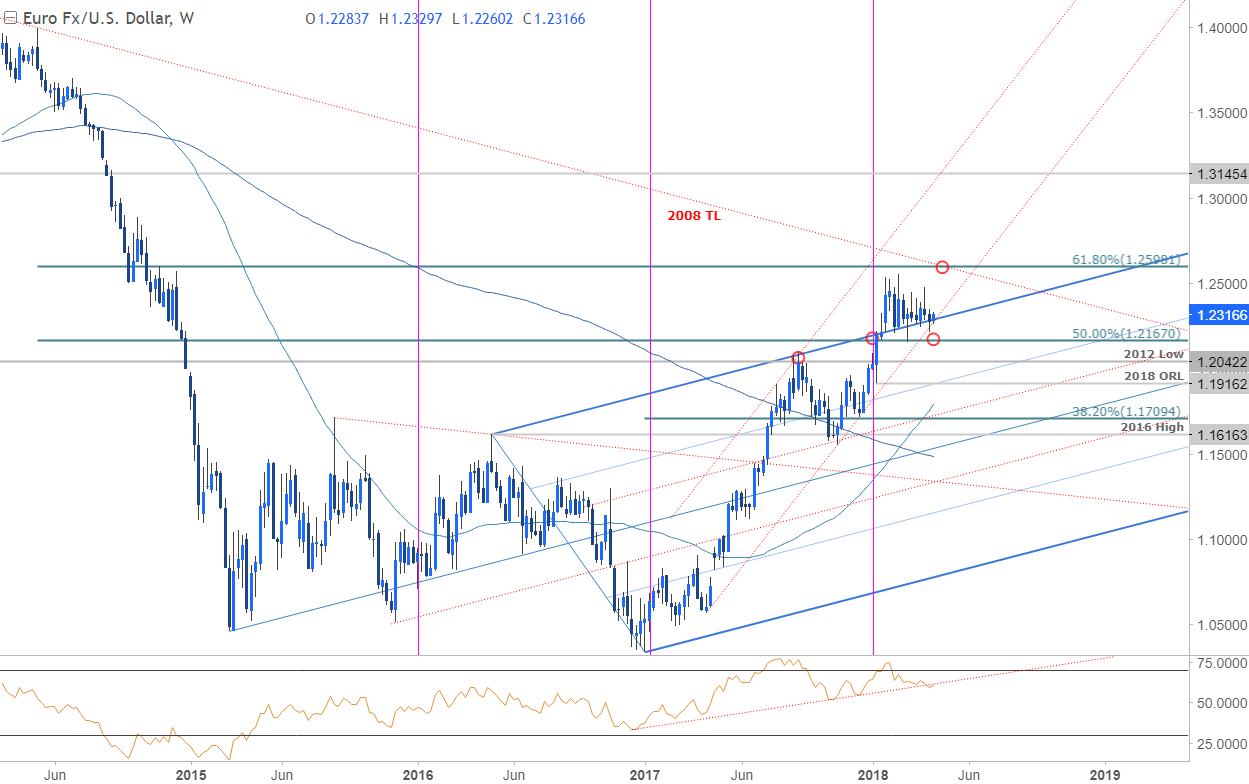
Notes: Euro has continued to consolidate above former slope resistance (blue) of the broader ascending pitchfork formation we’ve been tracking since 2016. Channel support extending off the April 2017 low also converges on this zone and further highlights the significance of this region this week. Note that weekly RSI closed below a three-point support trigger last week and casts a bearish stance on the momentum profile. Key resistance remains at 1.2598 where the 61.8% retracement of the 2014 decline converges on basic trendline resistance extending off the 2008 high.
Bottom Line: Price is testing up-trend support and the broader, “focus remains on a break of the 1.2167-1.2598 range for guidance with the risk weighted to the topside while above 1.2167.” A breach / close above the yearly high-week reversal close at 1.2409 would be needed to mark resumption targeting 1.2558/98. A downside break of this support zone shifts the focus towards the 2017 high at 1.2092 and the 2012 lows at 1.2042.
New to ForexTrading? Get started with this Free Beginners Guide
AUD/USD Weekly Price Chart
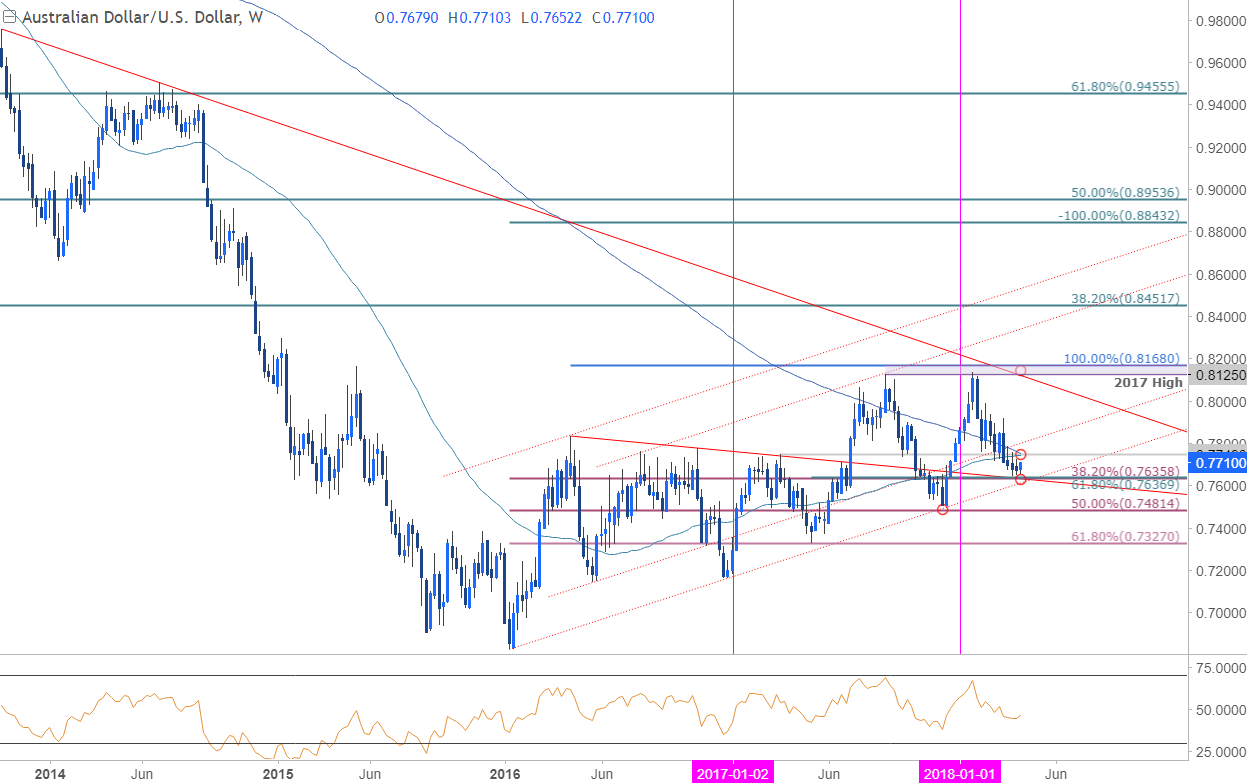
Notes: It’s all about this key support barrier this week for Aussie and our outlook / levels remain unchanged- “The Australian Dollar has approached a long-term support confluence we’ve been tracking since the start of the year at 7612/37. This region represents a critical inflection point for price and IF broken would risk a substantial sell-off in the Aussie. That said, we’re looking for signs of support this week with a breach above confluence resistance at 7750 needed to alleviate further downside pressure.” It’s make-or-break this week.
Bottom line: “The immediate short-bias is at risk heading into 7612/37 and from a trading standpoint I’ll be looking for evidence of a near-term low in this range. A break lower would keep the focus on subsequent support targets at 7481 and the 61.8% retracement of the 2016 advance at 7327.”
AUD/USD IG Client Positioning
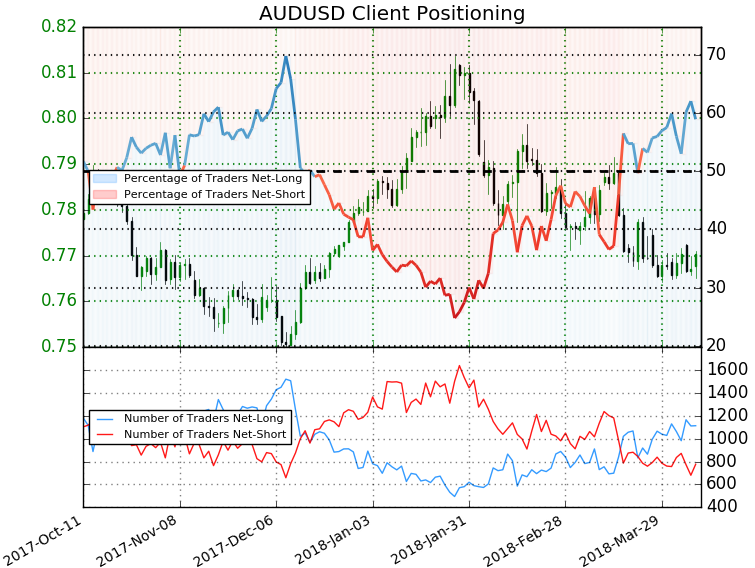
- A summary of IG Client Sentiment shows traders are net-long AUDUSD- the ratio stands at +1.43 (58.9% of traders are long) –weak bearishreading
- Retail has remained net-long since Mar 22nd; price has moved 0.2% higher since then
- Long positions are 1.4% higher than yesterday and 0.7% higher from last week
- Short positions are 6.7% higher than yesterday and 4.6% lower from last week
- We typically take a contrarian view to crowd sentiment, and the fact traders are net-long suggests AUDUSD prices may continue to fall. However traders are less net-long than yesterday but more net-long from last week andthe combination of current positioning and recent changes gives us a further mixed AUDUSD trading bias from a sentiment standpoint
Why does the average trader lose? Avoid these Mistakes in your trading
GBP/JPY Weekly Price Chart
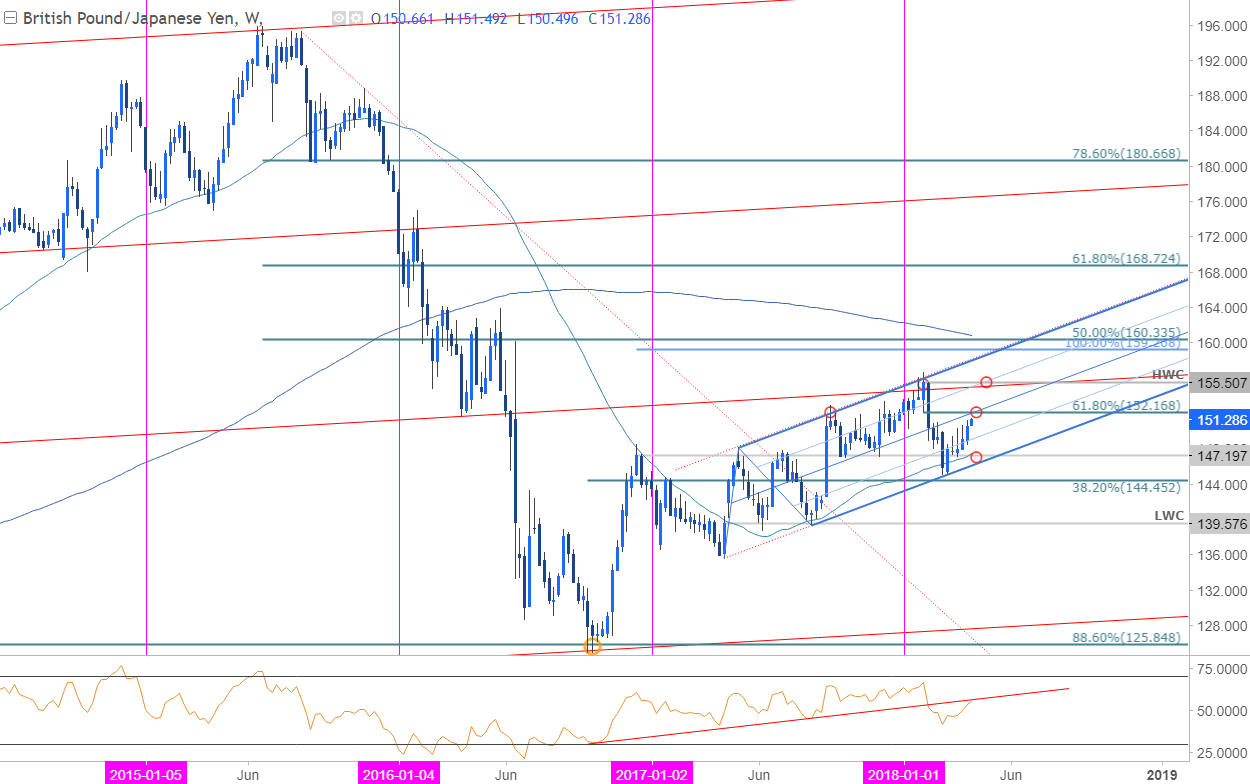
Notes: GBP/JPY has been trading within the confines of a well-defined ascending pitchfork formation extending off the 2017 low. The rebound off the lower parallel is now eyeing confluence resistance at 152.17 where the 61.8% retracement of the yearly range converges on the median-line. Interim support rests with the 50-line with bullish invalidation set to 147.00/50- a region defined by the lower parallel, the 52-week moving average and the December 2016 high-week reversal close (are of interest for possible long-entries).
Bottom line: The immediate long-bias is at risk heading into 152.17- we’ll be on the lookout for a near-term exhaustion high IF reached. A breach above keeps the uptrend in play with such a scenario targeting confluence resistance at the high-week close at 155.50.
Previous Weekly Technical Perspectives
- Weekly Technical Perspective on S&P 500, AUD/USD and AUD/JPY
- Weekly Technical Perspective on USD/CAD, USD/JPY and GBP/CAD
- Weekly Technical Perspective on DXY, GBP/USD and NZD/USD
--- Written by Michael Boutros, Technical Currency Strategist with DailyFX
To receive Michael’s analysis directly, please sign-up to his email distribution list
Follow Michael on Twitter @MBForex or contact him at mboutros@dailyfx.com


