


- A look at the weekly technicals on DXY, GBP/USD and NZD/USD
- Review Michael’s Foundations of Technical Analysis Series on Building a Trade Strategy
- Join Michael for Live Weekly Strategy Webinars on Mondays at 12:30GMT
In this series we scale-back and take a look at the broader technical picture to gain a bit more perspective on where we are in trend. Here are the key levels that matter on the weekly charts for the DXY, GBPUSD and NZDUSD ahead of this week’s FOMC, BoE and RBNZ interest rate decisions. Review this week’s Strategy Webinar for an in-depth breakdown of these setups and more.
Check out our New 2018 projectionsin our Free DailyFX Trading Forecasts
DXY Weekly Price Chart
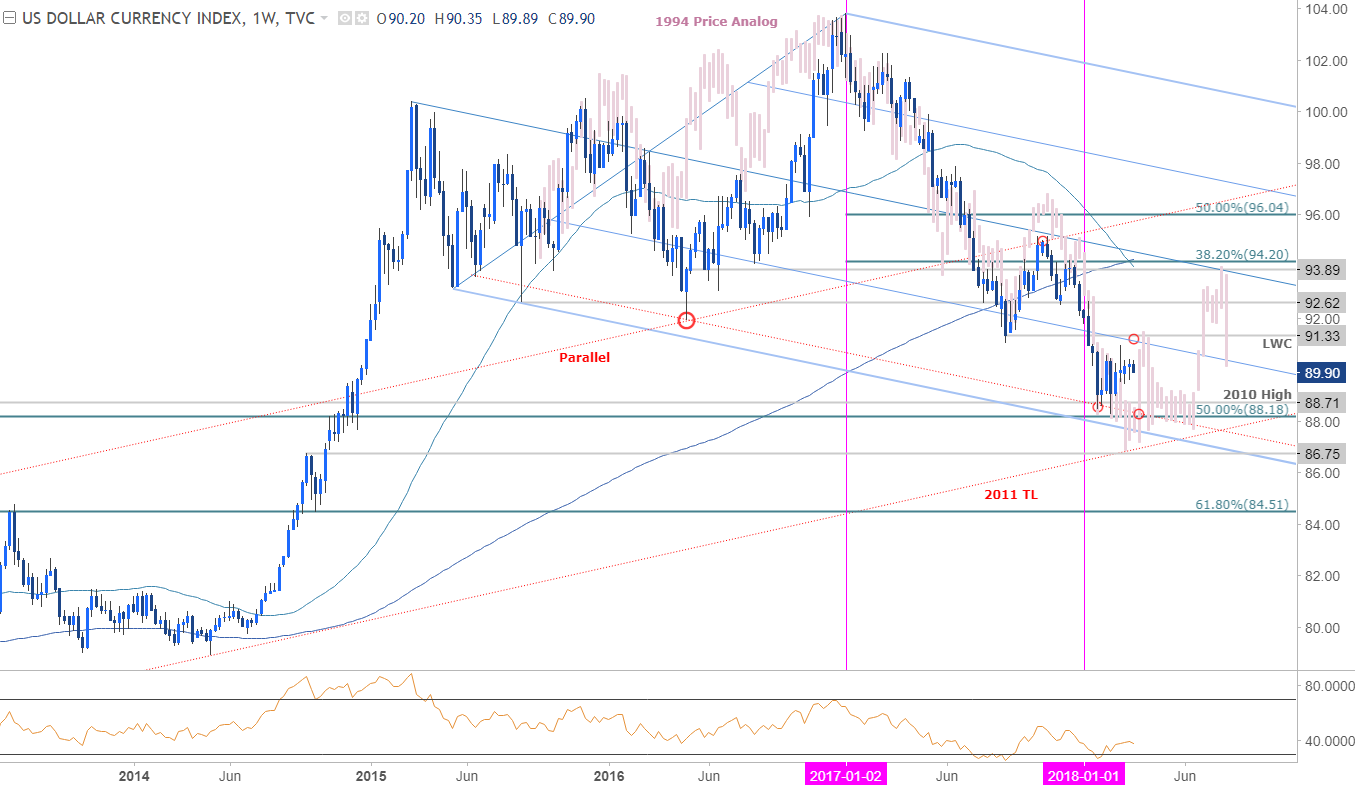
Notes: We’ve been tracking this price analog in the U.S. Dollar Index since last year and heading into the Federal Reserve interest rate decision on Wednesday, the risk remains lower while below the 2017 low-week close at 91.33 (bearish invalidation). Interim support rests with the 2010 high at 88.71 backed closely by confluence support at 88.18 where the 50% retracement of the 2011 advance converges on basic slope support.
Bottom Line: The focus remains on a break of the 88.18 - 91.33 price range. A downside break would likely fuel accelerated losses towards the 2011 trendline support around ~86.75 while a topside breach would suggest that a more significant low is in place.
New to ForexTrading? Get started with this Free Beginners Guide
GBP/USD Weekly Price Chart
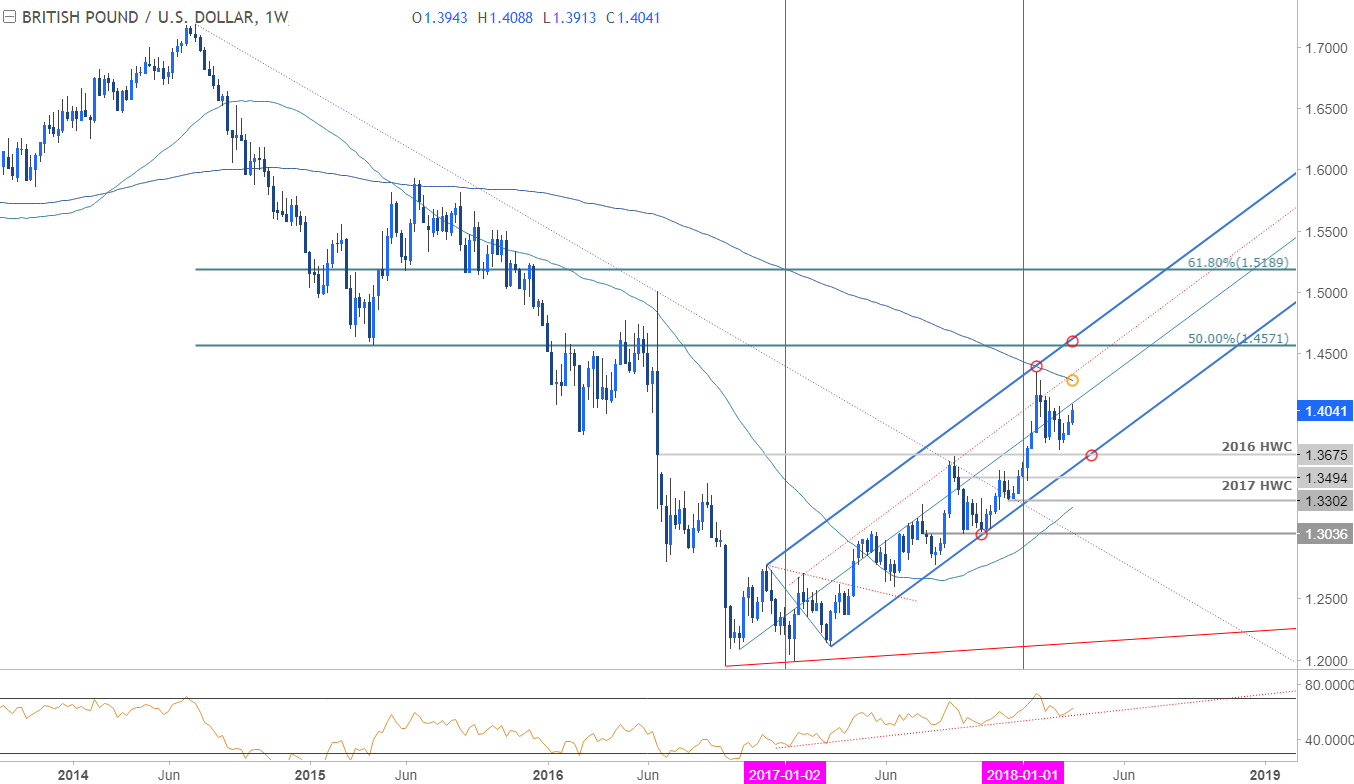
Notes: The British Pound has been trading within the confines of this ascending pitchfork formation extending off the 2016 / 2017 lows with prices turning just ahead of the upper median-line parallel early in the year. Price broke through the monthly opening-range last week and leaves the risk higher heading into the close of the month. That said, price is now approaching the median-line and a daily close above this threshold would be needed to keep the immediate advance viable.
Bottom line: The broader focus in Sterling remains weighted to the topside while above the lower median-line parallel / 2016 high-week close (Brexit) at 1.3675 (keep an eye on the RSI support trigger). A breach / close above the 2018 high-day close at 1.4134 would keep the long-bias in play targeting the 200-week moving average at ~1.4280s and the yearly high at 1.4346.
GBP/USD IG Client Positioning
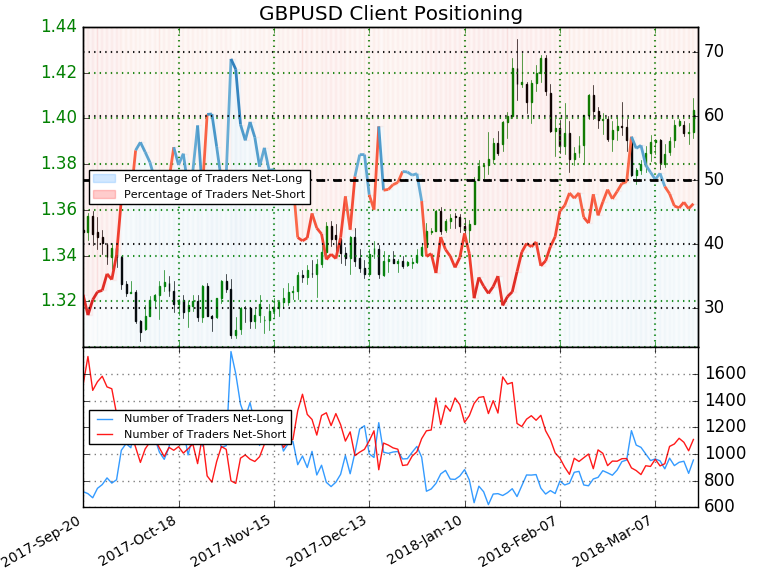
- A summary of IG Client Sentiment shows traders are net-short GBPUSD- the ratio stands at -1.16 (46.3% of traders are long) – weak bullishreading
- Long positions are 6.0% higher than yesterday and 1.5% lower from last week
- Short positions are 4.5% higher than yesterday and 9.1% higher from last week
- We typically take a contrarian view to crowd sentiment, and the fact traders are net-short suggests GBPUSD prices may continue to rise. However, retail is less net-short than yesterday but more net-short from last week and the combination of current positioning and recent changes gives us a further mixed GBPUSD trading bias from a sentiment standpoint.
Why does the average trader lose? Avoid these Mistakes in your trading
NZD/USD Weekly Price Chart

Notes: The New Zealand Dollar has continued to consolidate below the January highs at 7436 with the 200-week moving average catching the closes on the downside over the past few months. I’m looking for a resolution to this key price range over the coming weeks with key support (bullish invalidation) eyed at 7094-7140 where the 52-week moving average, 50% retracement, and the yearly open converge on basic slope support.
Bottom line: Kiwi remains in a well-defined range heading into the RBNZ interest rate decision later this week. Price may see some upside as we approach the range lows (note we turned today near monthly-open support at 7208) but ultimately, we’ll be looking for a breakout of this zone for near-term guidance. Note that near-term price action highlights a possible 5-wave decline off the monthly highs, suggesting that a recovery at these levels should prove correction and keeps the broader focus weighted to the downside for now.
Previous Weekly Technical Perspectives
- Weekly Technical Perspective on EUR/USD, EUR/JPY and EUR/AUD
- Weekly Technical Perspective on USD/CHF, AUD/USD and AUD/JPY
- Weekly Technical Perspective on USD/CAD, USD/JPY and GBP/CAD
--- Written by Michael Boutros, Technical Currency Strategist with DailyFX
To receive Michael’s analysis directly, please sign-upto his email distribution list
Follow Michael on Twitter @MBForex or contact him at mboutros@dailyfx.com


