


- GBP/USD testing confluence support / monthly range lows- Break risks substantial losses
- Check out our 2018 GBP/USD projections in our Free DailyFX Trading Forecasts
- Join Michael for Live Weekly Strategy Webinars on Mondays at 12:30GMT
The British Pound is down nearly 4% off the January high with the price now approaching key near-term confluence support. The focus is on a reaction here with a break lower risking substantial losses for Cable.
GBP/USD Daily Price Chart
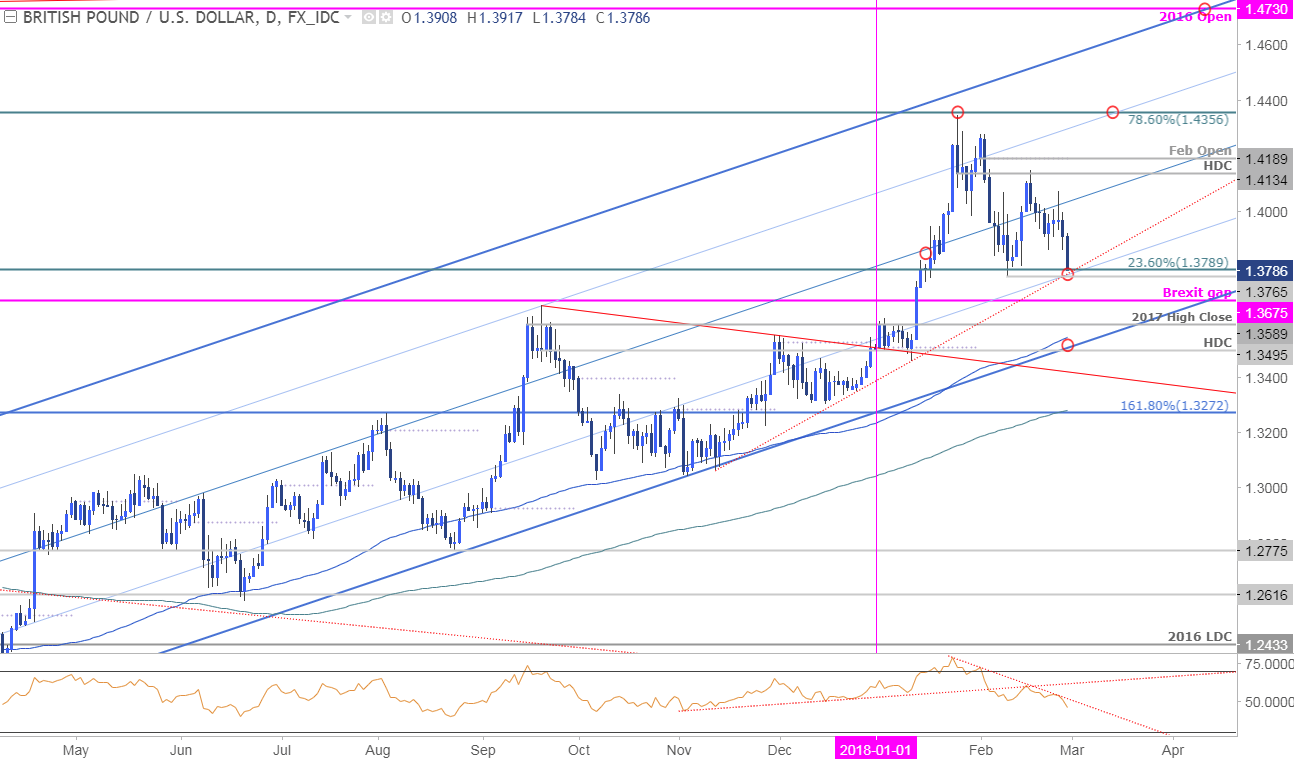
Technical Outlook: Sterling broke below the weekly opening-range yesterday with the decline now approaching key confluence support at 1.3765/89- a region defined by the 23.6% retracement of the 2017 advance and the February opening-range low. Note that basic trendline support extending off the November swing lows also converges on this threshold over the next few days and could limit the downside near-term.
A break / close below this threshold would risk substantial losses for the pound with such a scenario targeting subsequent daily support objectives at the Brexit gap at 1.3675, the 2017 high-close at 1.3589 and critical support at 1.3500/40 (broader bullish invalidation for the primary uptrend & an area of interest for long-entries IF reached)
New to Forex Trading? Get started with this Free Beginners Guide
GBP/USD 240min Price Chart
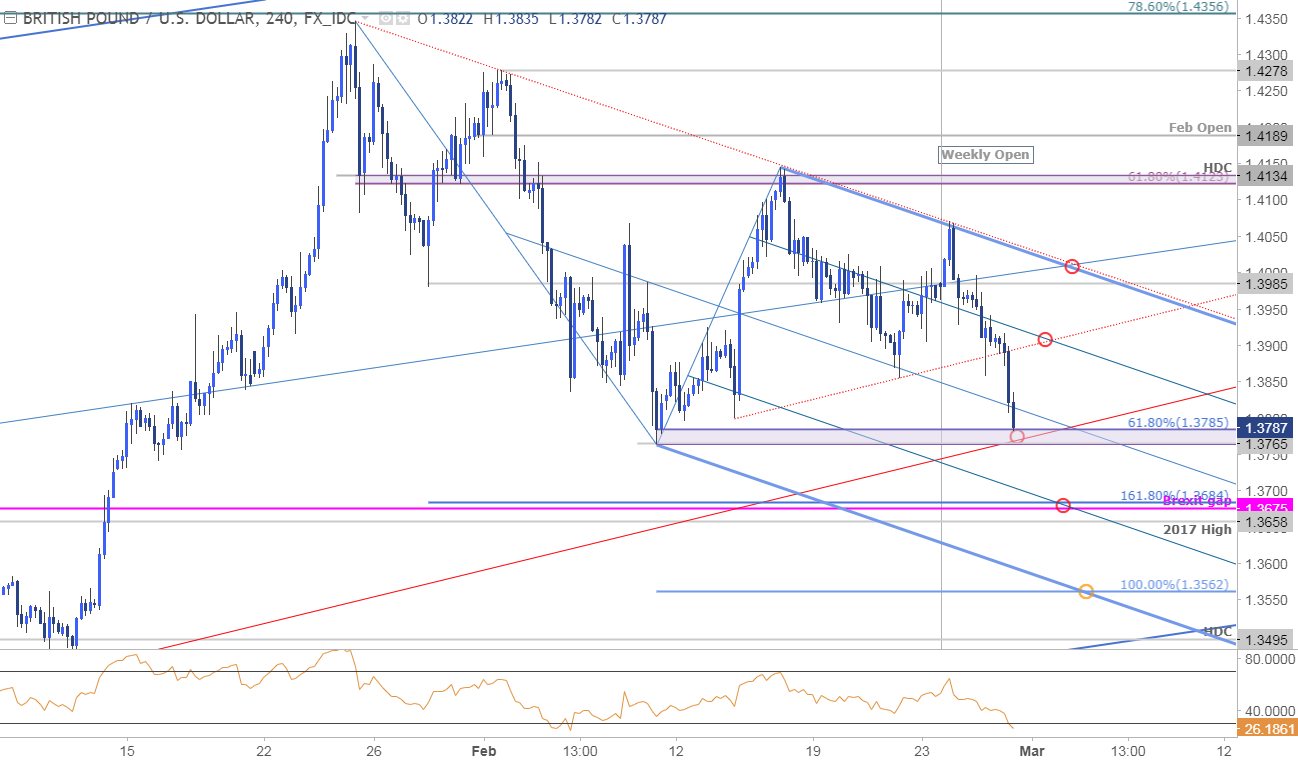
Notes: A closer look at Sterling price action highlights a near-term descending pitchfork formation extending off the yearly highs. Interim resistance now stands at the highlighted slope confluence around ~1.39 with bearish invalidation now lowered to the 1.40-handle. A break here at the 1.3765/85 support zone eyes subsequent targets at 1.3675/85 backed closely by the 2017 high at 1.3658 and the 100% extension at 1.3562.
Why does the average trader lose? Avoid these Mistakes in your trading
Bottom line: This is a significant pivot and we’re looking for a reaction here with the immediate downside bias at risk while above this support zone. A daily close below this level would be needed to keep the focus lower - ultimately, a larger set-back would offer more favorable long-entries with a breach above 1.40 needed to mark resumption of the broader up-trend. From a trading standpoint, I’ll be looking for a possible near-term exhaustion trade while above this threshold before breaking lower.
For a complete breakdown of Michael’s trading strategy, review his Foundations of Technical Analysis series on Building a Trading Strategy.
---
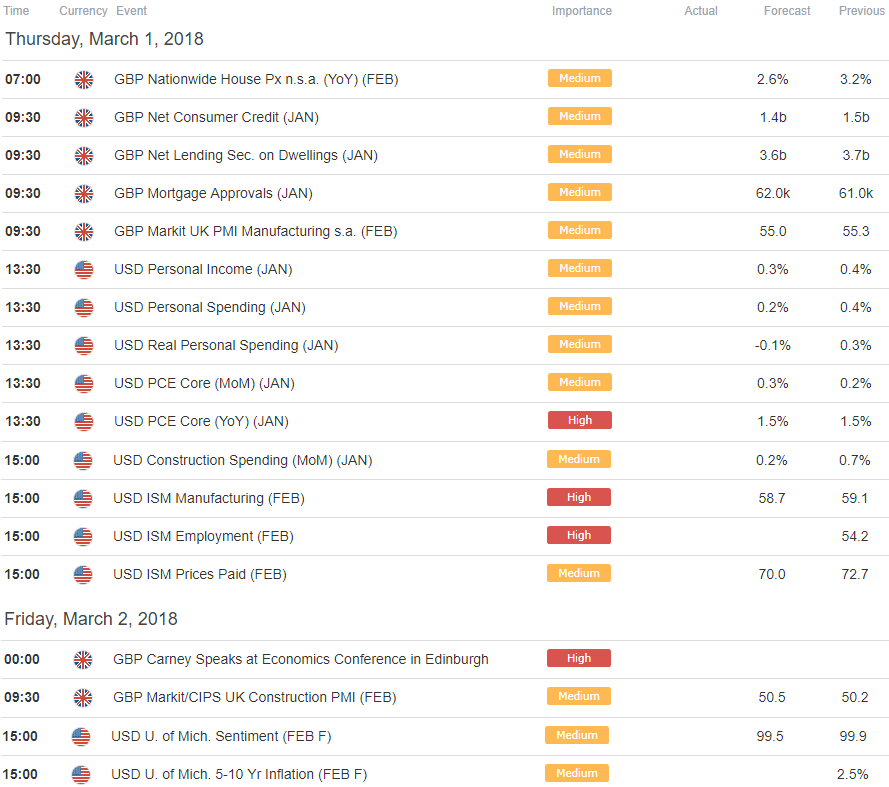
Relevant GBP/USD Data Releases
Other Setups in Play
- EUR/USD Price Analysis- Losses Likely to Be Limited, Levels to Know
- Weekly Technical Outlook: USD Down-Trend in Focus Ahead of March Open
- USD/CAD Surges Into Resistance- Rally Vulnerable Ahead of Canada CPI
- AUD/NZD Price Tumbles to Five-Month Lows; Relief in Sight?
- USD/JPY Price Analysis: Rebound to Offer Opportunity
- Written by Michael Boutros, Currency Strategist with DailyFX
To receive Michael’s analysis directly, please sign-upto his email distribution list
Follow Michael on Twitter @MBForex or contact him at mboutros@dailyfx.com


