


- A look at the weekly technicals on USD/CAD, USD/JPY & GBP/CAD
- Review Michael’s Foundations of Technical Analysis series on Building a Trade Strategy
- Join Michael for Live Weekly Strategy Webinars on Mondays at 12:30GMT
In this series we scale-back and take a look at the broader technical picture to gain a bit more perspective on where we are in trend. Here are the key levels that matter on the weekly charts heading into the monthly close. Review this week’s Strategy Webinar for an in-depth breakdown of these setups and more.
USD/CAD Weekly Price Chart
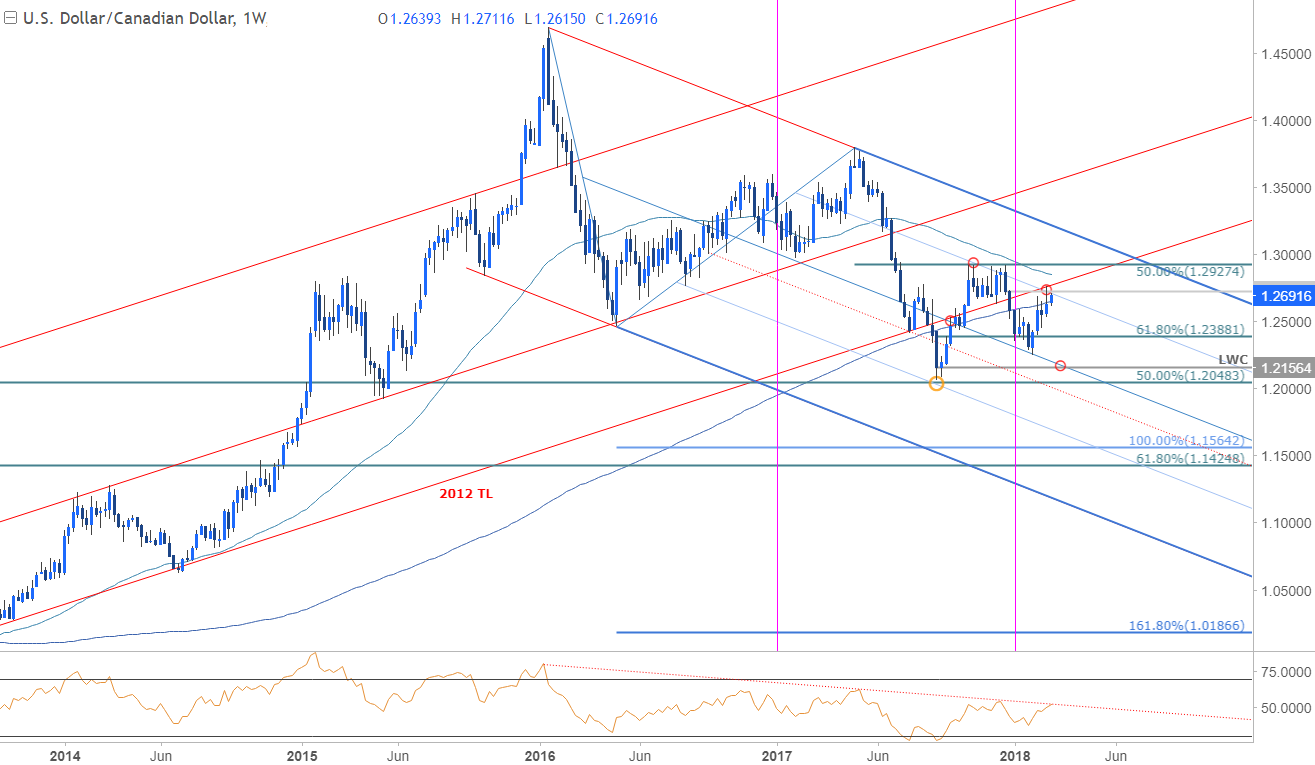
Notes: USD/CAD tested key near-term resistance last week at 1.2723/26 where the December high-day reversal close converges on the 50-line of the descending pitchfork formation and former trendline support, now resistance, extending off the 2012 low. As noted in last week’s USD/CAD Scalp Report, the recent advance is at risk below this level and we’re on the lookout for an exhaustion high here. Note that daily RSI is also testing a momentum resistance trigger extending off the 2016 high.
Bottom Line: The immediate advance remains vulnerable while below this threshold with interim support eyed at the 1.26-handle. A break / close below the 2018 open at 1.2579 would be needed to validate the near-term reversal with such a scenario targeting 1.2388-1.2410. Critical support rests with the 2017 low-week reversal close at 1.2156. A breach higher from here would risk a rally up towards the 200-week moving average at ~1.2850s and the 50% retracement at 1.2927.
New to ForexTrading? Get started with this Free Beginners Guide
USD/CAD IG Client Positioning

- A summary of IG Client Sentiment shows traders are net-long USD/CAD- the ratio stands at +1.07 (51.6% of traders are long) – bearishreading
- Retail has remained net-longsince February 19th; price has moved 1.0% higher since then
- Long positions are 6.0% lower than yesterday and 19.4% lower from last week
- Short positions are 9.0% lower than yesterday and 11.1% lower from last week
- We typically take a contrarian view to crowd sentiment, and the fact traders are net-long suggests USD/CAD prices may continue to fall. Traders are more net-long than yesterday but less net-long from last week. The combination of current positioning and recent changes gives us a further mixed USD/CAD trading bias from a sentiment standpoint.
Check out our New 2018 projectionsin our Free DailyFX Trading Forecasts
USD/JPY Weekly Price Chart
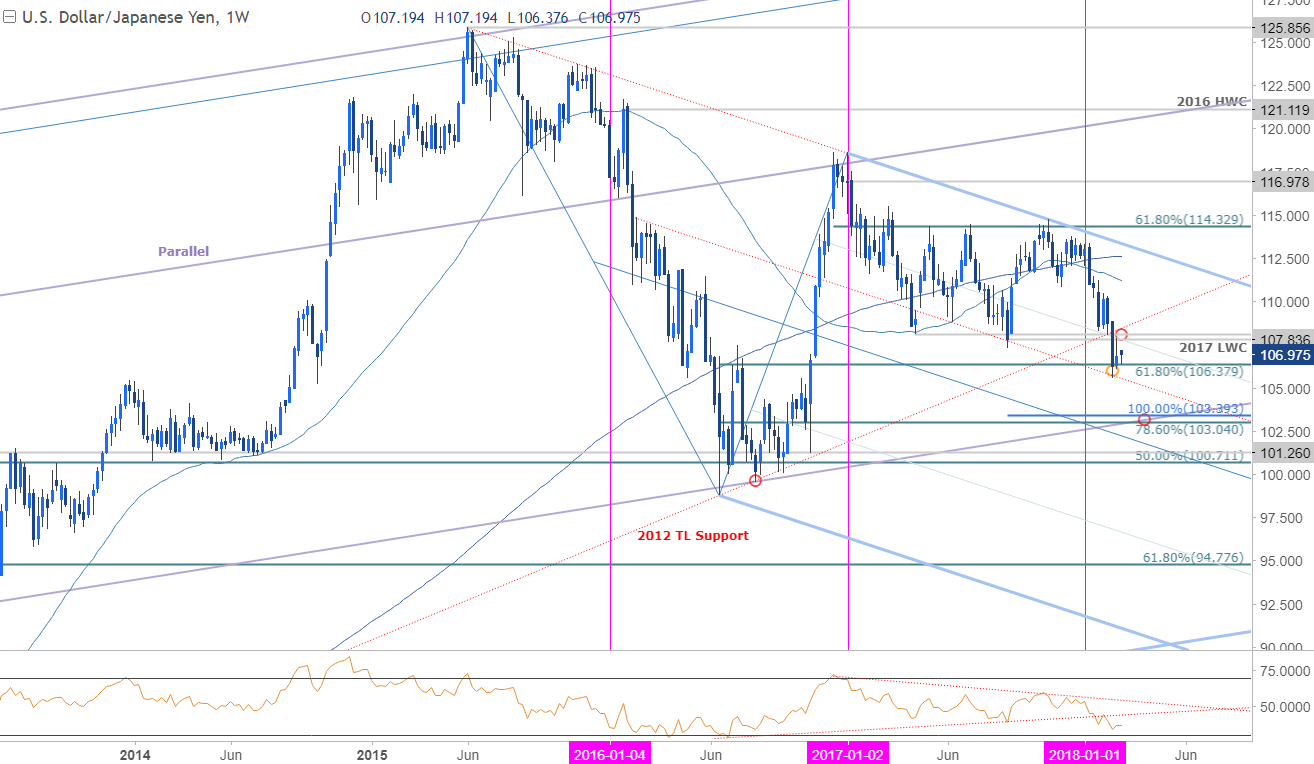
Notes: Earlier this month we noted that, “USD/JPY broke below confluence support at 107.84 this week with prices now probing the 61.8% retracement of the 2016 advance at 106.38…this support zone could interrupt things a bit but look to fade strength sub-107.84 with a break lower targeting confluence support at 103.04/40 where the 100% extension and the 78.6% retracement converge on broader slope support (critical).”
Bottom line:The outlook remains unchanged from last week’s USD/JPY Scalp Update and heading into the monthly close the risk remains lower while below the 2012 trendline.
Why does the average trader lose? Avoid these Mistakes in your trading
GBP/CAD Weekly Price Chart
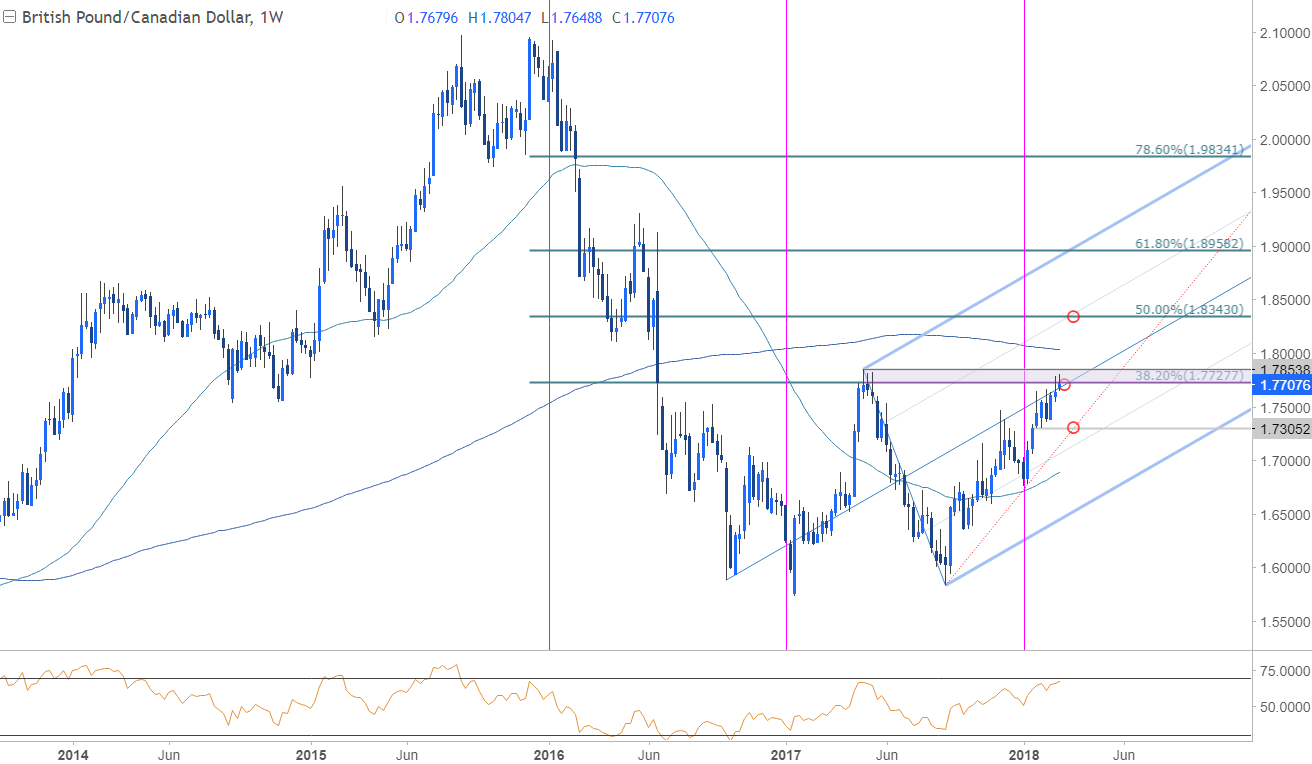
Notes: GBP/CAD is testing a key resistance zone at 1.7728-1.7854 where the 2017 high and the 38.2% retracement of the 2015 decline converge on the median-line of the 2016 ascending pitchfork (also note the Brexit weekly reversal close). The immediate advance is at risk heading into this region with a weekly close needed to mark resumption. Such a scenario targets the 200-week moving average at ~1.8020s backed by confluence resistance at 1.8343. Key weekly support rests at 1.7305 with a breach below the 50-line / 1.71 needed to suggest ta larger correction is underway.
Bottom line: From a trading standpoint we’re on the lookout for signs of exhaustion in price this week while below 1.7854. Ultimately a larger set-back would offer more favorable long-entries targeting a breach of this 2017 range.
Previous Weekly Technical Perspectives
- Weekly Technical Perspective on DXY, USD/JPY, AUD/NZD and U.S. Bonds
- Weekly Technical Perspective on AUD/USD, USD/CAD, AUD/NZD and Bitcoin
- Weekly Technical Perspective on DXY, USD/JPY and NZD/USD
--- Written by Michael Boutros, Technical Currency Strategist with DailyFX
Follow Michaelon Twitter @MBForex contact him at mboutros@dailyfx.com or Click Here to be added to his email distribution list.


