


- XRP/USD prices up more than 100%- pares February losses into monthly open resistance
- Check out our 2018 quarterly projections in our Free DailyFX Trading Forecasts
- Join Michael for Live Weekly Strategy Webinars on Mondays at 12:30GMT
Ripple prices have come full circle with the broad based rally in cryptocurrencies this week paring the early-February losses. The advance takes prices into monthly open resistance and while prices may be vulnerable here near-term the broader outlook remains constructive.
Ripple Daily Price Chart (Log)
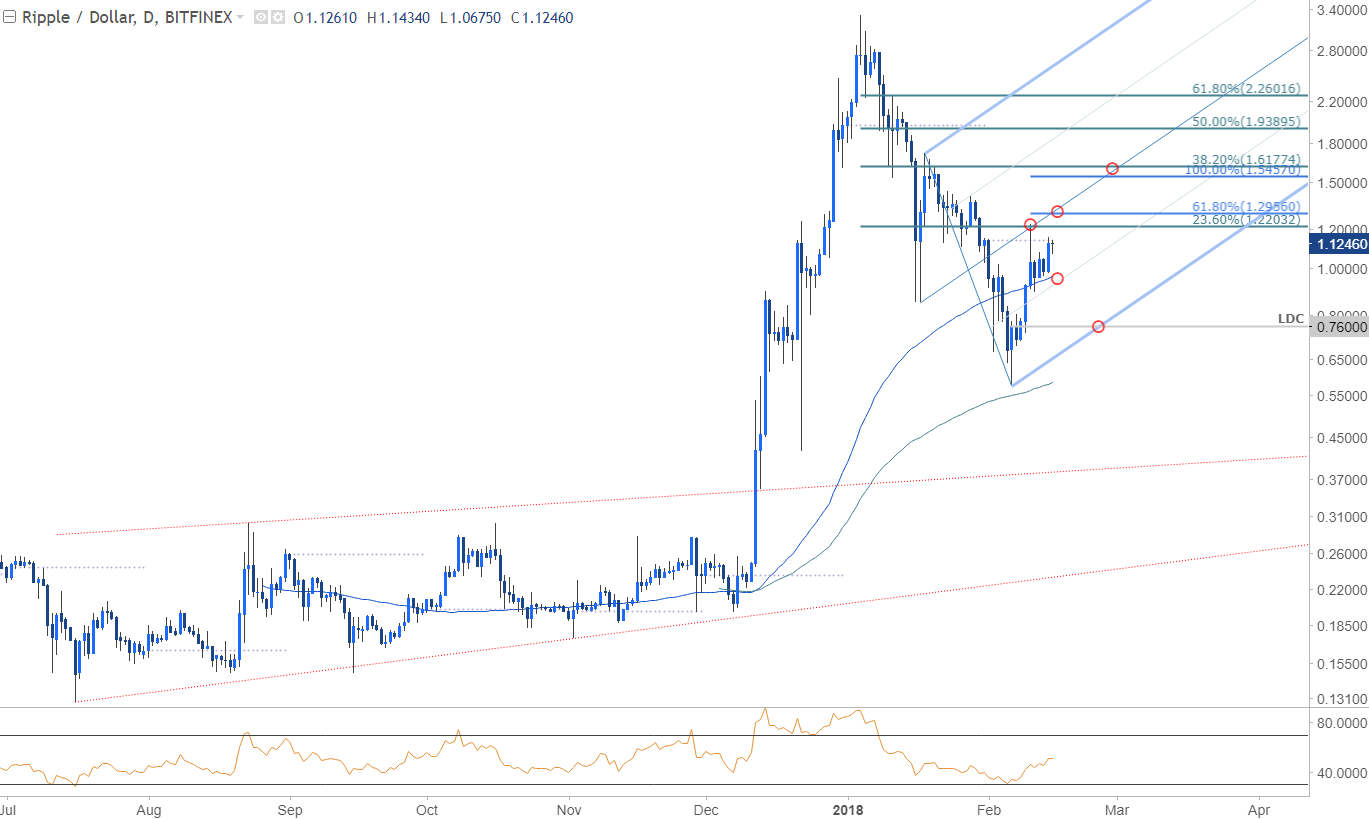
Technical Outlook: Ripple prices are up over 100% off the February lows with the advance now testing monthly open resistance at 1.1407. An ascending pitchfork formation extending off the January lows keeps the focus higher while above near-term support at ~9646 where the 100-day moving average converges on the 50-line. Broader bullish invalidation remains steady at the 2018 low-day close at 7600.
New to Forex Trading? Get started with this Free Beginners Guide
Ripple 240min Price Chart (Log)
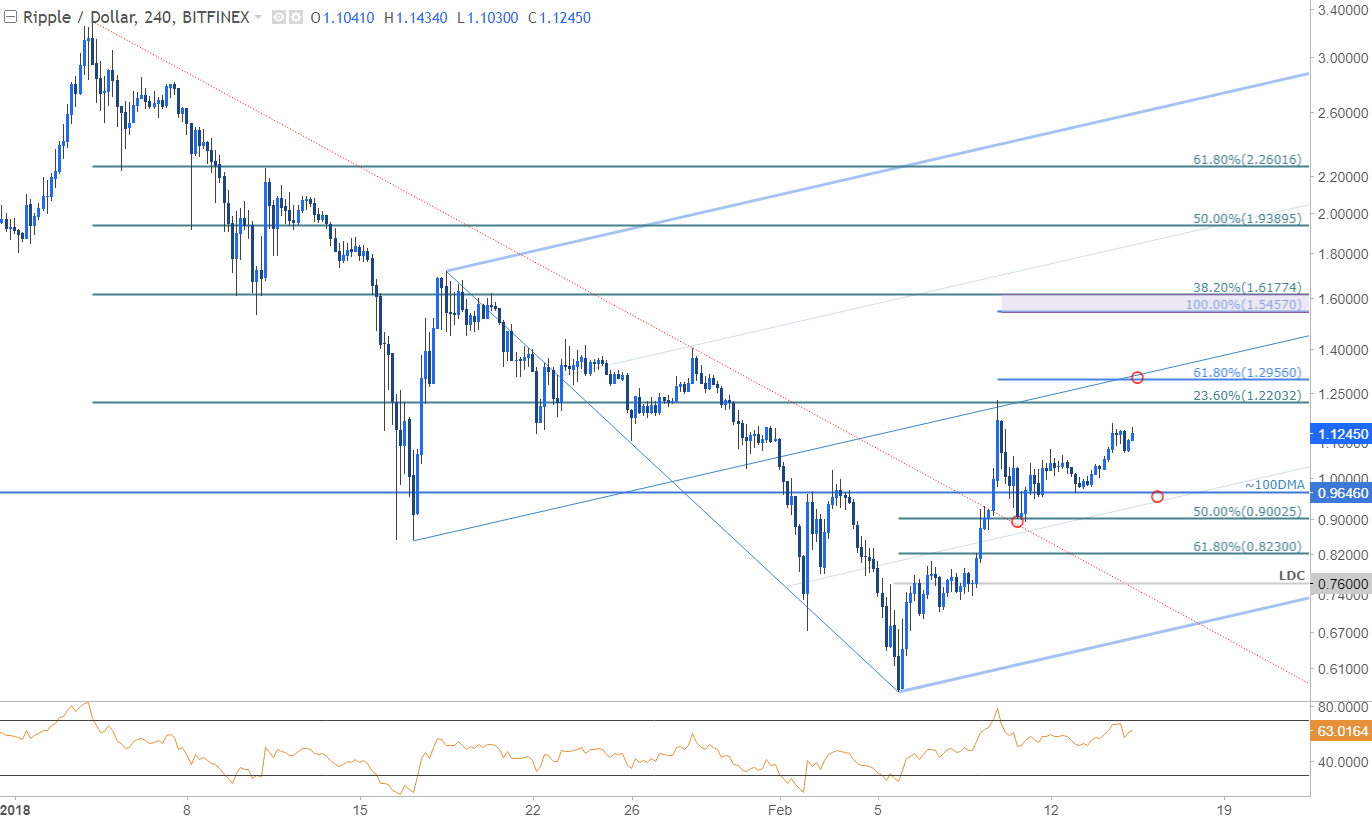
Notes: A closer look at Ripple price action sees the cryptocurrency breaking above basic trendline resistance extending off the record highs late-last week with a pullback and defense of this slope further validating the near-term breakout. Interim resistance targets eyed at 1.2203 backed by the median-line / 61.8% extension at 1.2956 – a breach there would be needed to fuel the next leg higher in price with such a scenario targeting subsequent resistance objectives at 1.5457 backed closely by 1.6177.
Why does the average trader lose? Avoid these Mistakes in your trading
Interim support rests with the 100-day moving average, currently at ~9646 backed closely by the 50-line. Ultimately a break below the 90-handle would suggest a larger correction is underway targeting the 61.8% retracement at 8230 and the low-day close at 7600.
Bottom line: The immediate advance looks a bit vulnerable here but the broader focus remains weighted to the topside while above the monthly / yearly low-day close. From a trading standpoint, I’ll favor fading weakness into structural support OR buying a break and retest of the median-line (1.2956) as support for a move back towards the 1.6177.
For a complete breakdown of Michael’s trading strategy, review his Foundations of Technical Analysis mini-series
XRP/USD IG Client Sentiment
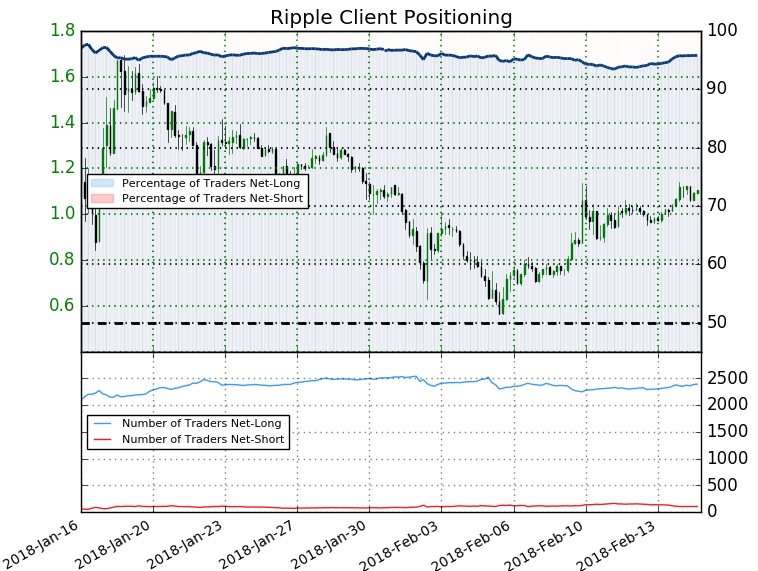
- A summary of IG Client Sentiment shows traders are net-long XRP/USD- the ratio stands at +22.58 (95.8% of traders are long) – bearishreading
- Traders remained net-long since Dec 25th; price has moved 55.5% lower since then
- Long positions are 2.3% higher than yesterday and 0.5% lower from last week
- Short positions are20.3% lower than yesterday and 2.8% lower from last week
- We typically take a contrarian view to crowd sentiment, and the fact traders are net-long suggests Ripple prices may continue to fall. Traders are further net-long than yesterday and last week, and the combination of current positioning and recent changes gives us a stronger Ripple-bearish contrarian trading bias from a sentiment standpoint.
See how shifts in XRP/USD retail positioning are impacting trend- Click here to learn more about sentiment!
---
Other Setups in Play
- Ethereum Prices Rally into Resistance – What Now?
- Litecoin Prices Rip Into Resistance Ahead of Hard Fork
- Bitcoin Price Surges 57% off Monthly Lows- Bullish Breakout Potential
- USD/CAD Price Rally at Risk Ahead of Canada Employment
- Written by Michael Boutros, Currency Strategist with DailyFX
To receive Michael’s analysis directly via email, please SIGN UP HERE
Follow Michael on Twitter @MBForex or contact him at mboutros@dailyfx.com


