


- ETH/USD breaches through February opening-range highs; constructive above 162
- Check out our 2018 quarterly projections in our Free DailyFX Trading Forecasts
- Join Michael for Live Weekly Strategy Webinars on Mondays at 12:30GMT
Ethereum prices reversed sharply just ahead of slope support last week with the advance now challenging near-term downtrend resistance. A breach here would be needed to validate a reversal of the multi-month downtrend with such a scenario targeting a rally back towards the monthly open.
Ether Daily Price Chart (Log)
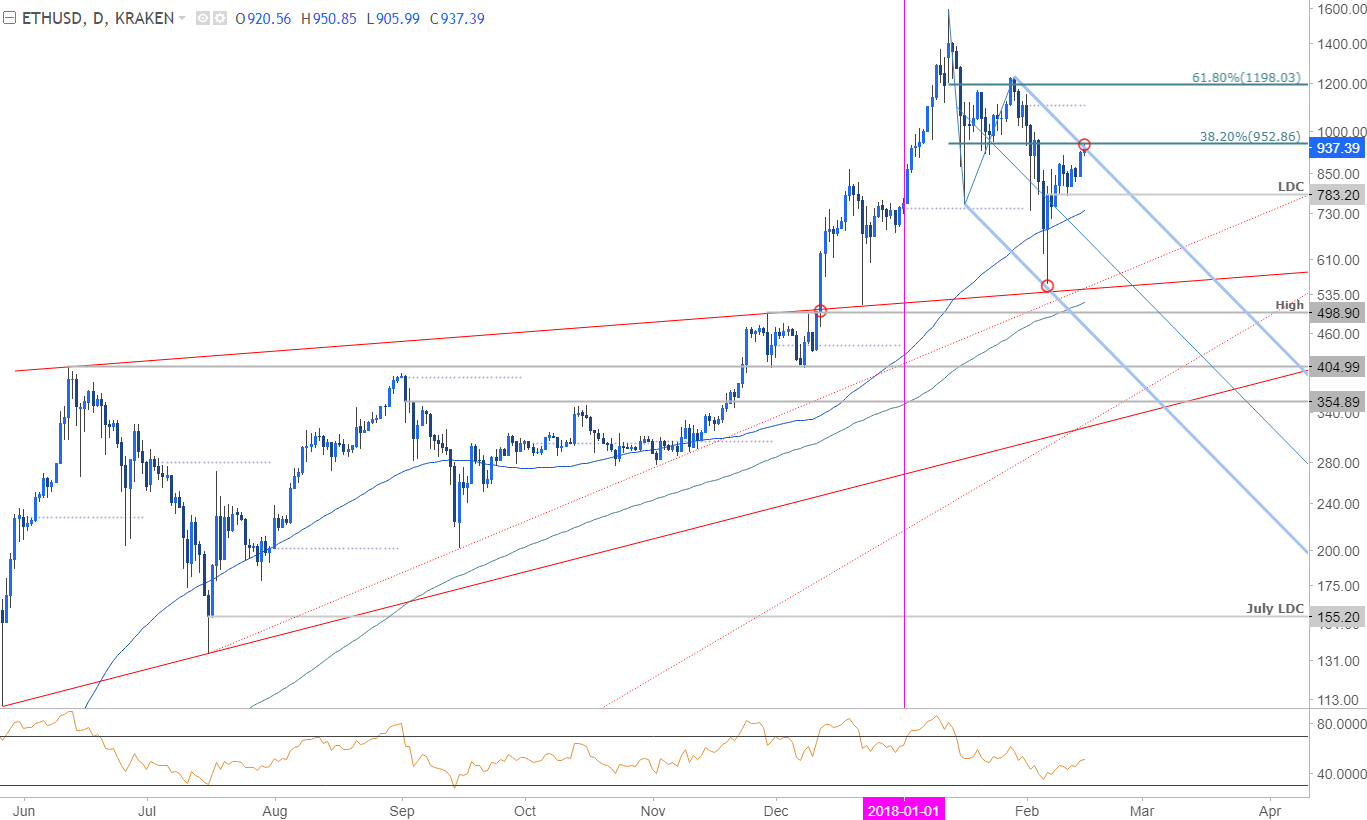
Technical Outlook: Ethereum prices have rallied more than 70% off the February lows with the advance now testing confluence resistance at ~953 where the 38.2% retracement of the decline converges on the upper parallel of the descending pitchfork. The immediate advance may be vulnerable here near-term and we’re looking for a reaction off this mark into the close of the week.
New to Forex Trading? Get started with this Free Beginners Guide
A breach higher targets the monthly open at 1105 backed by the 61.8% retracement at 1198. Daily support rests with the 2018 low-day close (LDC) at 783 with our bullish invalidation now raised to the 100-day moving average at 738.
Ether 240min Price Chart (Log)
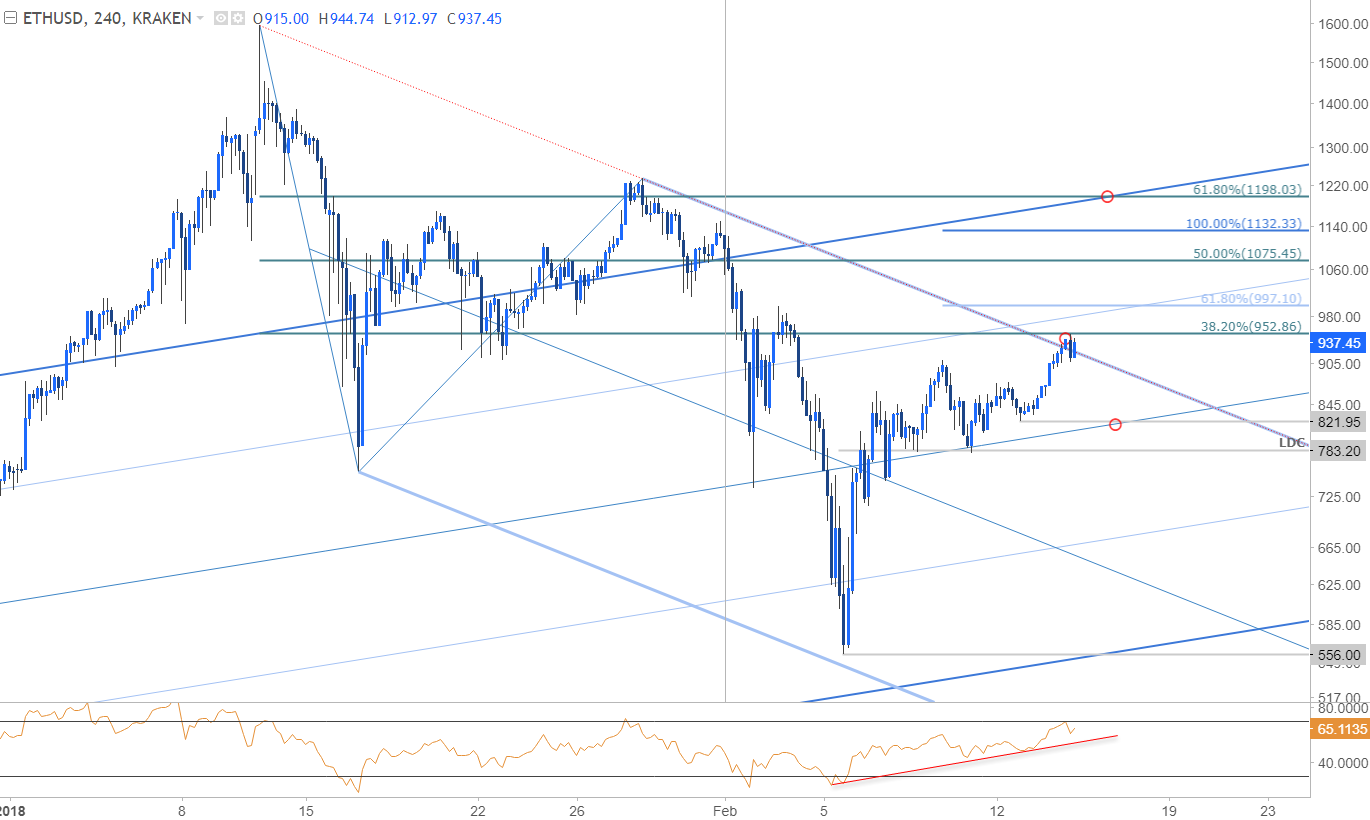
Notes: A closer look at Ethereum price action further highlights near-term resistance here at 953. Look for interim support at the median-line / 822 with our near-term bullish invalidation level raised to the low-day close at 783- both areas of interest for possible exhaustion / long-entries IF reached.
Why does the average trader lose? Avoid these Mistakes in your trading
A breach targets subsequent resistance objectives at 997 backed by the 50% retracement a 1075, 1105 and the 100% extension at 1132. Bottom line: It’s make-or-break here for Ether and the risk remains for a pullback while below near-term resistance. I’ll favor fading weakness into structural support OR buying a break and retest of near-term resistance as support for a move back towards the monthly highs.
For a complete breakdown of Michael’s trading strategy, review his Foundations of Technical Analysis mini-series
ETH/USD IG Client Sentiment
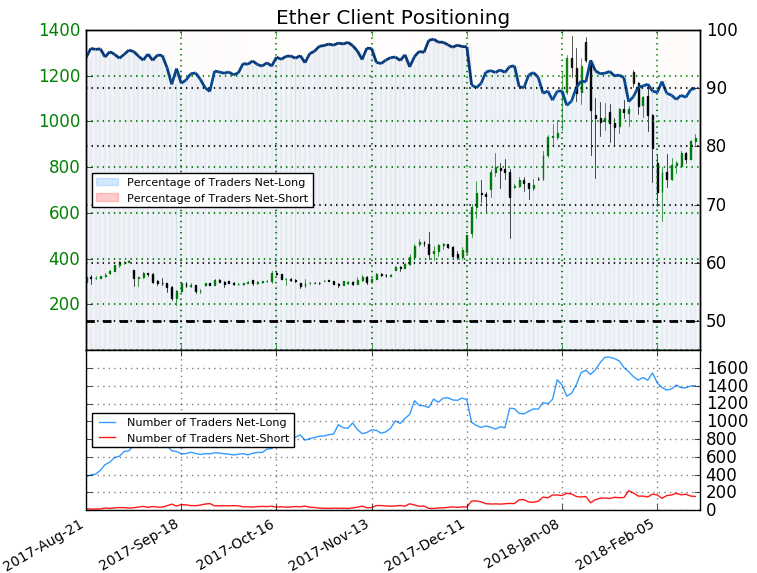
- A summary of IG Client Sentiment shows traders are net-long ETH/USD- the ratio stands at +9.03 (90.0% of traders are long) – bearishreading
- Traders remained net-long since Jul 7th; price has moved 279.5% higher since then
- Long positions are 1.5% higher than yesterday and 1.3% higher from last week
- Short positions are16.2% lower than yesterday and 3.7% lower from last week
- We typically take a contrarian view to crowd sentiment, and the fact traders are net-long suggests Ether prices may continue to fall. Traders are further net-long than yesterday and last week, and the combination of current positioning and recent changes gives us a stronger Ether-bearish contrarian trading bias from a sentiment standpoint.
See how shifts in Ethereum retail positioning are impacting trend- Click here to learn more about sentiment!
---
Other Setups in Play
- Litecoin Prices Rip Into Resistance Ahead of Hard Fork
- Bitcoin Price Surges 57% off Monthly Lows- Bullish Breakout Potential
- USD/CAD Price Rally at Risk Ahead of Canada Employment
- GBP/USD Bears to Face BoE- Levels to Know for Super Thursday
- EUR/USD Down but Not Out as Prices Approach Bullish Trend Support
- Written by Michael Boutros, Currency Strategist with DailyFX
To receive Michael’s analysis directly via email, please SIGN UP HERE
Follow Michael on Twitter @MBForex or contact him at mboutros@dailyfx.com


