


- A look at the weekly technicals on GBP/USD, USD/CAD & USD/CHF
- Review the Foundations of Technical Analysis mini-series
- Join Michael for Live Weekly Strategy Webinars on Mondays at 12:30GMT
In this series we scale-back and take a look at the broader technical picture to gain a bit more perspective on where we are in trend. Here are the key levels that matter heading into the close of January trade. Review this week’s Strategy Webinar for an in-depth breakdown of these setups and more.
GBP/USD Weekly Chart

Notes: Earlier this month we noted that the immediate focus for the British Pound was, “on a break of the 1.33-1.3675 range” with a breach higher to target, “subsequent topside objectives into the median-line near the 38.2% retracement at 1.3952.” Price is testing this threshold now and a weekly close above would be needed to keep the immediate advance viable.
Bottom line: While our broader outlook remains weighted to the topside, price is now testing up-trend resistance and could limit advances near-term. Interim support now rests at 1.3675 with bullish invalidation now raised to 1.3494. A breach higher from here eyes subsequent topside objectives at the median-line parallel at around ~1.4140s backed by the upper parallel / 200-week moving average at ~1.44.
New to Trading? Get started with this Free Beginners Guide
GBP/USD IG Client Positioning
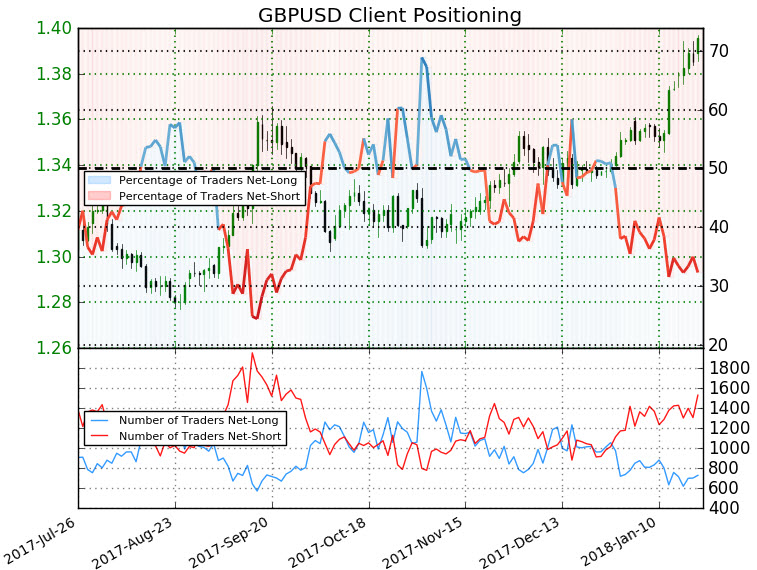
- A summary of IG Client Sentiment shows traders are net-short GBP/USD- the ratio stands at -2.1 (32.3% of traders are long) – bearishreading
- Retail has remained net-short since Dec 28th; price has moved 4.5% higher since then
- Long positions are 8.2% lower than yesterday and 10.8% lower from last week
- Short positions are 12.7% higher than yesterday and 17.2% higher from last week
- We typically take a contrarian view to crowd sentiment, and the fact traders are net-short suggests GBPUSD prices may continue to rise. Traders are further net-short than yesterday and last week, and the combination of current sentiment and recent changes gives us a stronger GBPUSD-bullish contrarian trading bias.
See how shifts in GBP/USD retail positioning are impacting trend- Click here to learn more about sentiment!
USD/CAD Weekly Chart
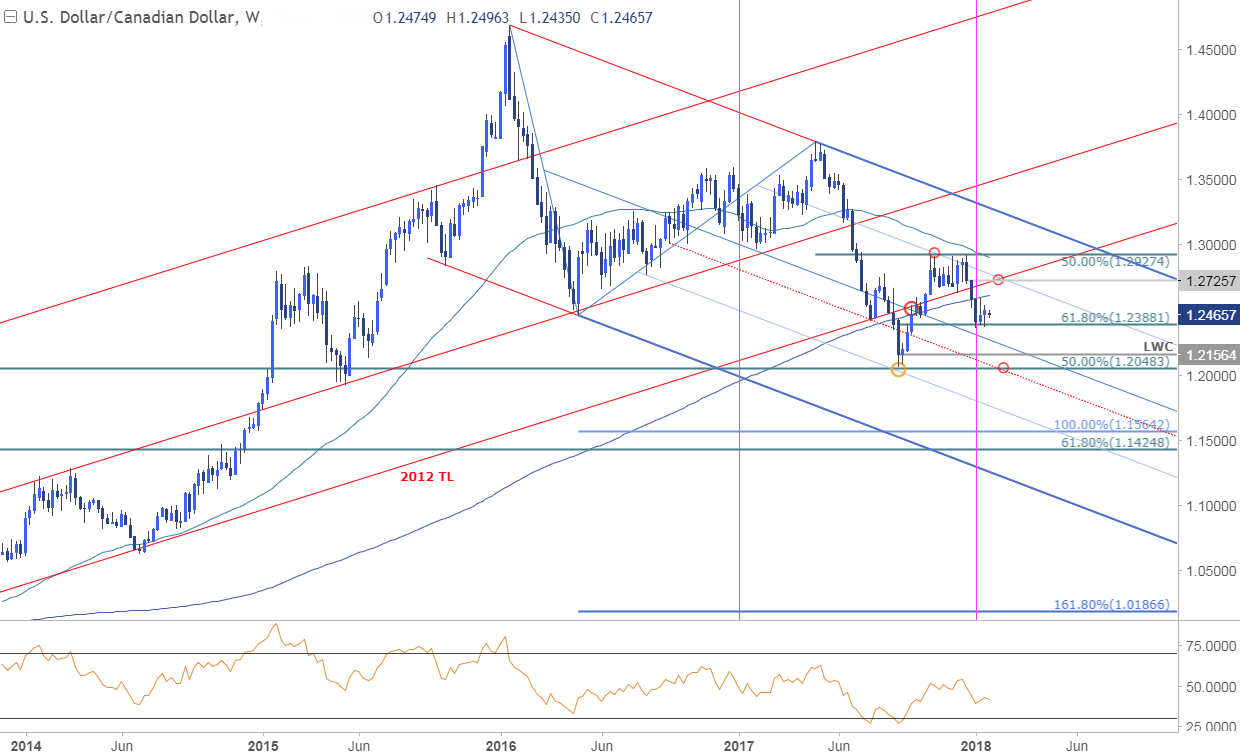
Notes: USD/CAD has carved out its monthly opening-range just above the 61.8% retracement of the September advance at 1.2388. Interim resistance stands at the monthly / yearly open which converges on the 200-week moving average at 1.2579-1.26.The immediate focus is on a break of this range with the medium-term bearish invalidation set to 1.2725.
Bottom line: Looking for a break of this range for near-term guidance with the broader focus lower while below the 50-line. A break lower targets the median-line (blue ~1.2260s) backed by the 2017 low-week close at 1.2156 and the 50 retracement at 1.2048.
Why does the average trader lose? Avoid these Mistakes in your trading
USD/CHF Weekly Chart

Notes: USD/CHF reversed off confluence support last week around 9553- a region defined by the 78.6% retracement of the September advance and the median-line extending off the 2015 high. Initial resistance stands with the 200-week moving average at ~9656 backed by yearly open resistance at 9744. Broad bearish invalidation stands with the yearly opening range highs / upper parallel at 9845/80.
Bottom line: We’re on the lookout for a possible near-term recovery to ultimately offer more favorable short-entries with a break lower targeting confluence support at 9444/72 and the 2011 trendline, currently around 9400.
Check out our New USD/CAD 2018 projectionsin our Free DailyFX Trading Forecasts
Previous Weekly Technical Perspectives
- A Weekly Technical Perspective on USD/JPY, EUR/JPY, Crude Oil
- A Weekly Technical Perspective on DXY, GBP/USD, AUD/USD
- A Weekly Technical Perspective on Gold, Copper, Crude
- Written by Michael Boutros, Technical Currency Strategist with DailyFX
Follow Michaelon Twitter @MBForex contact him at mboutros@dailyfx.com or Click Here to be added to his email distribution list.


