


To receive Michael’s analysis directly via email, please SIGN UP HERE
- USD/CAD up more than 7% off yearly lows; at risk near-term below confluence resistance
- Check out our 3Q USD/CAD projections in our Free DailyFX Trading Forecasts
- Join Michael for Live Weekly Strategy Webinars on Mondays at 12:30GMT
USD/CAD Weekly Chart

Technical Outlook: A breach back above former trendline support extending off the 2012 low (and the October opening-range) shifted the focus higher earlier this month with the rally now approaching confluence resistance around ~1.2927- a region defined by the 50% retracement of the 2017 range and the 50-line of the descending pitchfork extending of the 2016 high (note the 52-week moving average just higher). Weekly support rests back at the trendline, currently ~1.2590s.
USD/CAD Daily Chart
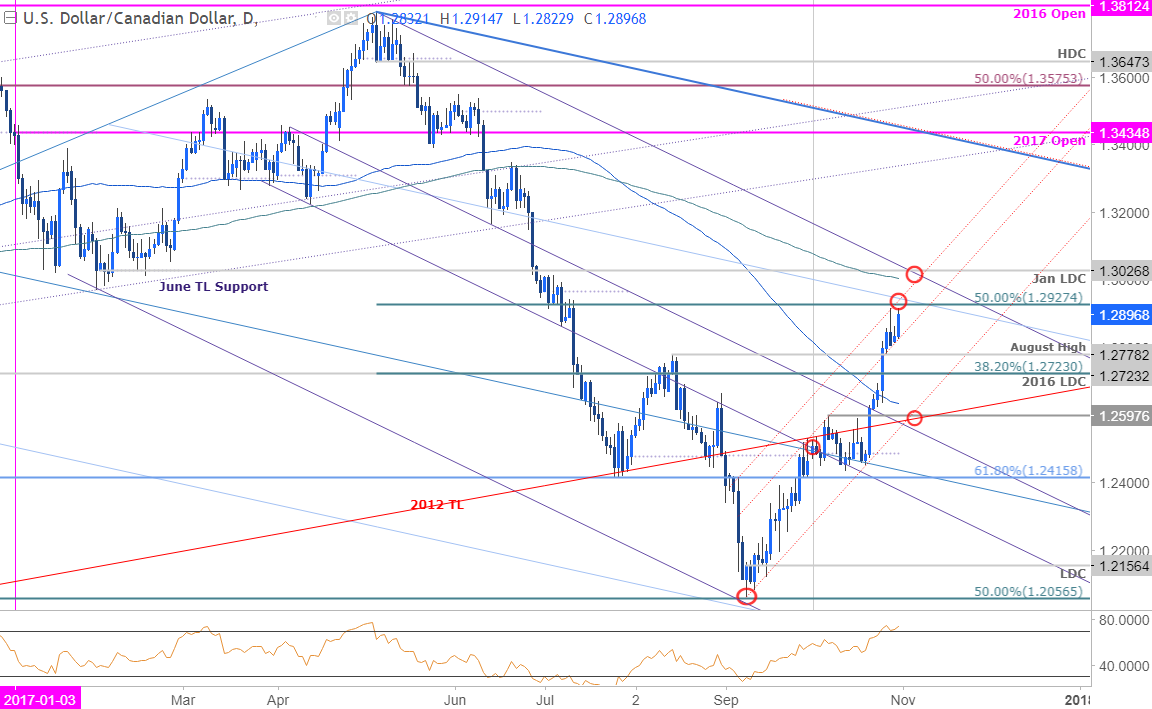
The daily chart further highlights this region of resistance. Note that the 200-day moving average / January low-day close rests just higher and converges on basic trendline resistance off the yearly highs at ~1.3000/26. A breach / close above this region would be needed to validate a more meaningful breakout with such a scenario targeting upper median-line parallel / 2017 open at 1.3400/35.
New to Forex? Get started with this Free Beginners Guide
USD/CAD 240min Chart

Notes: A closer look at price actions has the weekly opening range taking shape just below resistance at 1.2927. Look for support along the parallel with a break below 1.2757/78 needed to validate a more significant reversal targeting 1.2663 & bullish invalidation at 1.2590/97– an area of interest for exhaustion / long-entries.
Bottom line: the pair is up more than 7% off the lows with the immediate rally at risk near-term while below confluence resistance. Keep in mind we still have the FOMC interest rate decision and more importantly, the announcement Thursday on President Trump’s pick for Fed Chairman. The fun doesn’t end there though, Friday is likely to be a key tell for Loonie price action with both the U.S. Non-Farm Payroll (NFP) report AND Canada employment figures on tap. The November open looks very promising.
Join Michael on Friday for his bi-weekly Live Webinar on the Foundations of Technical Analysis- Register for Free Here!
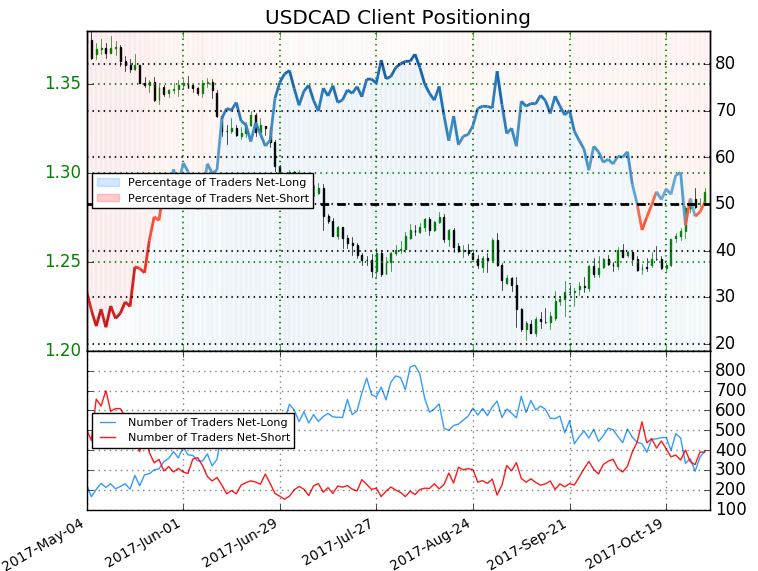
- A summary of IG Client Sentiment shows traders are net-long USDCAD- the ratio stands at +1.02 (50.4% of traders are long) – Weak bearishreading
- Long positions are 17.8% higher than yesterday and 20.6% lower from last week
- Short positions are 3.2% higher than yesterday and 4.5% higher from last week
- We typically take a contrarian view to crowd sentiment, and the fact traders are net-long suggests USDCAD prices may continue to fall. However retail is more net-long than yesterday but less net-long from last week andthe combination of current positioning and recent changes gives us a further mixed USDCAD trading bias from a sentiment standpoint.
See how shifts in USD/CAD retail positioning are impacting trend- Click here to learn more about sentiment!
---
Relevant Data Releases

Check out this week’s DailyFX Webinar Schedule
Other Setups in Play
- Weekly Technical Outlook: Stormy Seas Heading into BoE, FOMC & NFP
- EUR/JPY Plummets into Monthly Lows
- EUR/USD Flirts with Disaster as Post-ECB Selloff Targets Key Support
- Four-Day Losing Streak Breaks Aussie Down to Three-Month Lows
- Written by Michael Boutros, Currency Strategist with DailyFX
Follow Michael on Twitter @MBForex or contact him at mboutros@dailyfx.com.


