


To receive Michael’s analysis directly via email, please SIGN UP HERE
- Euro approaching long-term structural support- Weekly close critical
- Check out our 3Q EUR/USD projections in our Free DailyFX Trading Forecasts
- Join Michael for Live Weekly Strategy Webinars on Mondays at 12:30GMT
EUR/USD Daily Chart
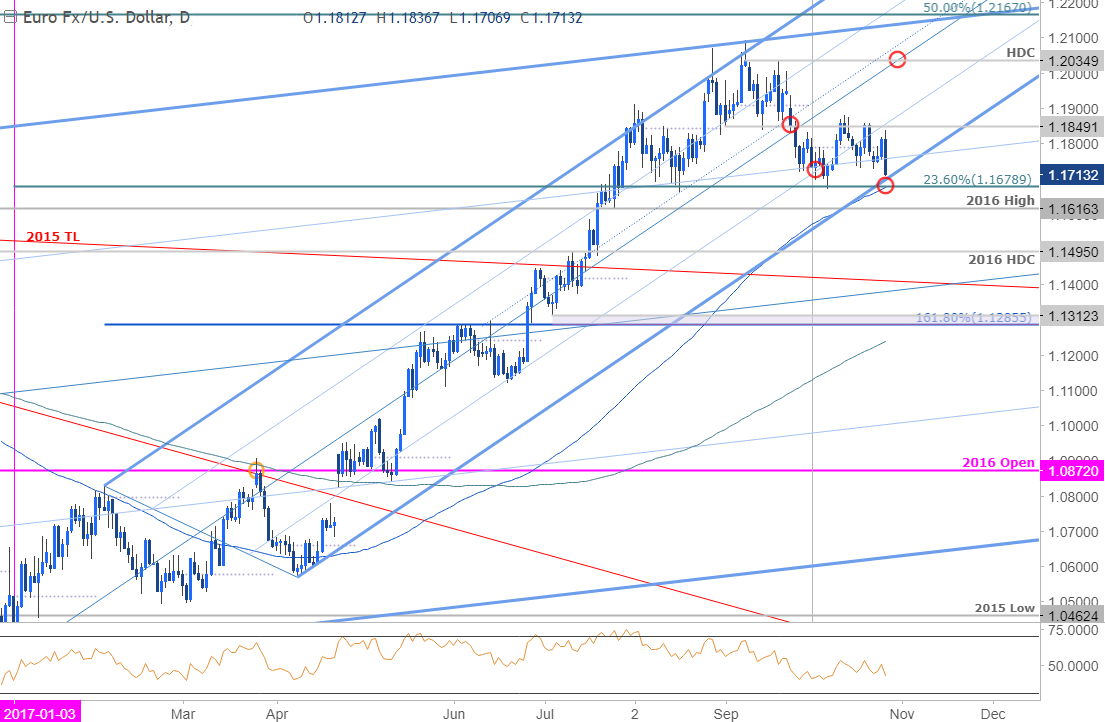
Technical Outlook: The post-ECB Euro sell-off is approaching a key support confluence at the 1.1679-1.1707- a region defined by the lower median-line parallel, the 23.6% retracement of the 2017 range and the 100-day moving average. Note that the monthly opening-range lows also converges on this region further highlights the technical significance of this zone. A break / close below the mark would shift the medium-term outlook to the downside for the pair with such a scenario targeting the 2016 high at 1.1616 backed by the 2016 high-day close at 1.1495 and the slope confluence ~1.1400.
New to Forex? Get started with this Free Beginners Guide
EUR/USD 240min
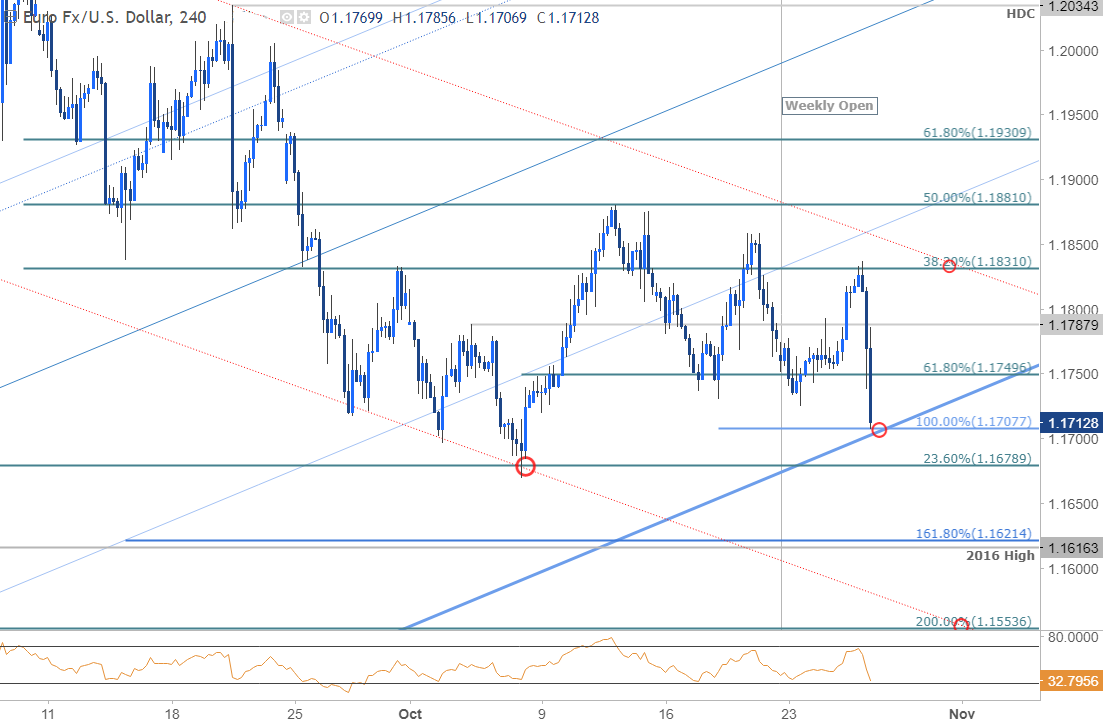
Notes: A closer look at price action highlights this support confluence- look for a reaction here with a close sub-1.1679 needed to validate the break. Interim resistance stands at 1.1750 backed by 1.1788. A breach above channel resistance / 1.1831 would be needed to shift the focus back to the long-side of the pair.
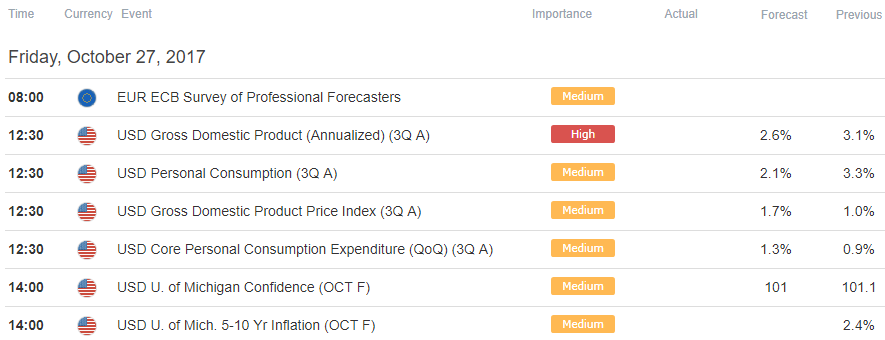
A break below the monthly opening-range lows targets initial support objectives at 1.1616/21 & 1.1554. From a trading standpoint, the break of the objective weekly opening-range does keep the focus lower but I would caution chasing this from here if you’re not already short. Keep in mind we get the release of U.S. 3Q GDP figures tomorrow and the event is likely to fuel increased volatility in the USD crosses. As discussed in our Weekly Strategy Outlook, thetechnical implications of this week’s close will be significant.
Join Michael on Friday for his bi-weekly Live Webinar on the Foundations of Technical Analysis- Register for Free Here!
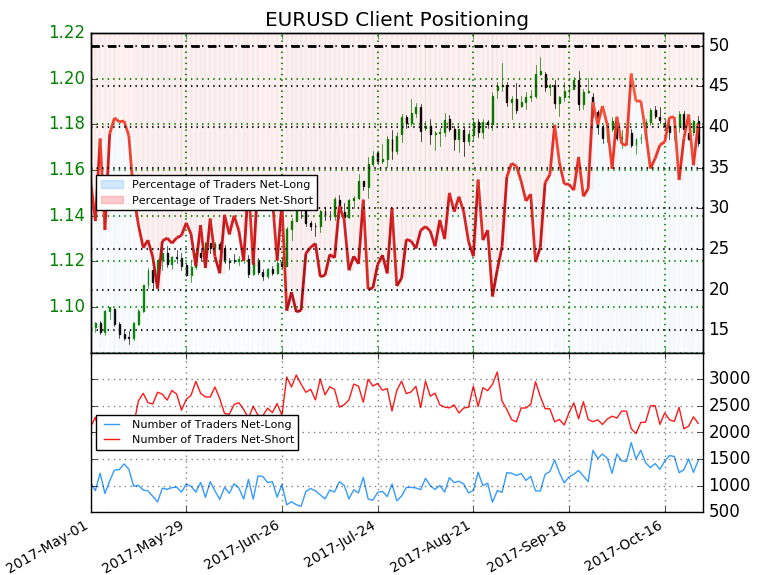
- A summary of IG Client Sentiment shows traders are net-short EURUSD- the ratio stands at -1.48 (40.4% of traders are long) – Weak bullish reading
- Long positions are 6.6% lower than yesterday and 3.4% lower from last week
- Short positions are 0.6% higher than yesterday and 4.4% lower from last week
- We typically take a contrarian view to crowd sentiment, and the fact traders are net-short suggests EURUSD prices may continue to rise. Positioning is more net-short than yesterday but less net-short from last week and the combination of current positioning& recent changes gives us a further mixed EURUSD trading bias from a sentiment standpoint.
See how shifts in EUR/USD retail positioning are impacting trend- Click here to learn more about sentiment!
---
Relevant Data Releases
Check out this week’s DailyFX Webinar Schedule
Other Setups in Play
- Four-Day Losing Streak Breaks Aussie Down to Three-Month Lows
- Ethereum Prices Settle on Fibonacci Support
- Weekly Technical Outlook: USD Turn or Burn at Key Resistance
- USD/CAD Battle Lines Drawn Ahead of Canada CPI
- Written by Michael Boutros, Currency Strategist with DailyFX
Follow Michael on Twitter @MBForex or contact him at mboutros@dailyfx.com.


