


To receive Michael’s analysis directly via email, please SIGN UP HERE
- Ethereum prices virtually unchanged- Broader outlook remains constructive
- Check out our new 4Q projections in our Free DailyFX Trading Forecasts
- Join Michael for Live Weekly Strategy Webinars on Mondays at 12:30GMT
ETH/USD Daily Chart
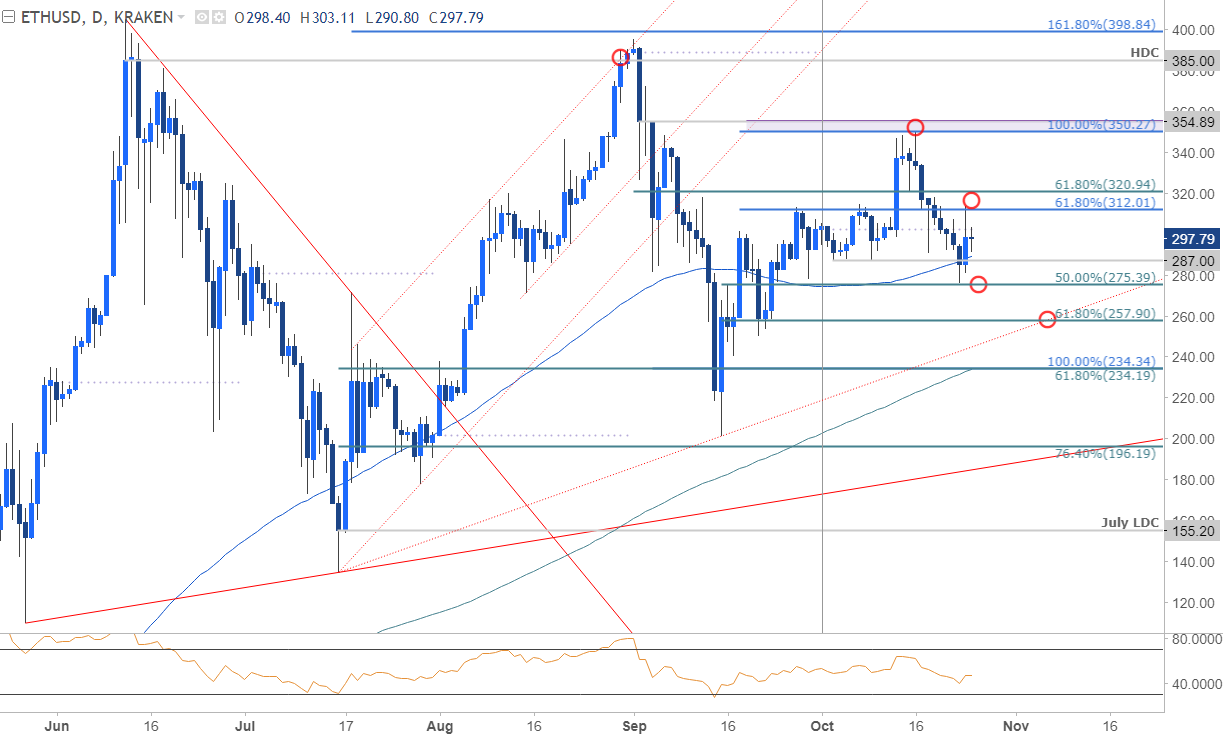
Technical Outlook: Earlier this month we noted that Ethereum prices had carved out an, “impressive monthly opening-rang just below key resistance at 312/21- a region defined by the 61.8% retracement of the September decline and the 61.8% ext of the advance off the subsequent lows.” A topside breach on October 13 saw prices rally into confluence resistance at 350/55 before reversing sharply lower. The decline failed to hold below the monthly opening-range lows with prices trading just below the monthly open.
The focus now falls on the 275-312/20 range- look for the break for guidance with broader bullish invalidation now set to confluence support at 257. A topside breach once again looks for a test of the 350/55 resistance barrier where the 9/2 reversal-day close converges on the 100% ext.
New to Forex? Get started with this Free Beginners Guide
ETH/USD 240min
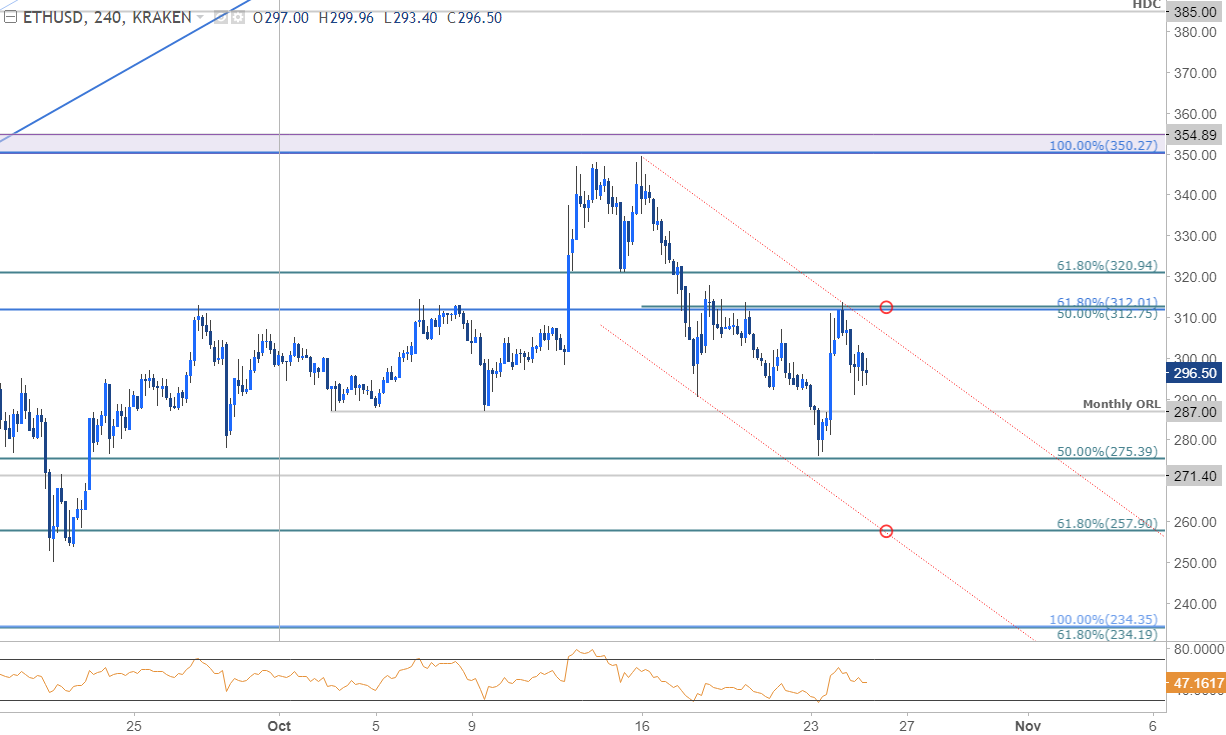
Notes: A closer look at price action further highlights the clear pivot back below the 312 inflection point. A near-term slope of the highs may be in play here and keeps the immediate focus lower while below this region. That said, a break lower would targets confluence support at the 61.8% retracement / lower parallel at 257- an area of interest for exhaustion / long-entries. Bottom line: the immediate risk is lower while with in this formation but ultimately, I want to be long on either a dip into key support OR a breach and retest of the 312 pivot zone.
Join Michael on Friday for his bi-weekly Live Webinar on the Foundations of Technical Analysis- Register for Free Here!
---
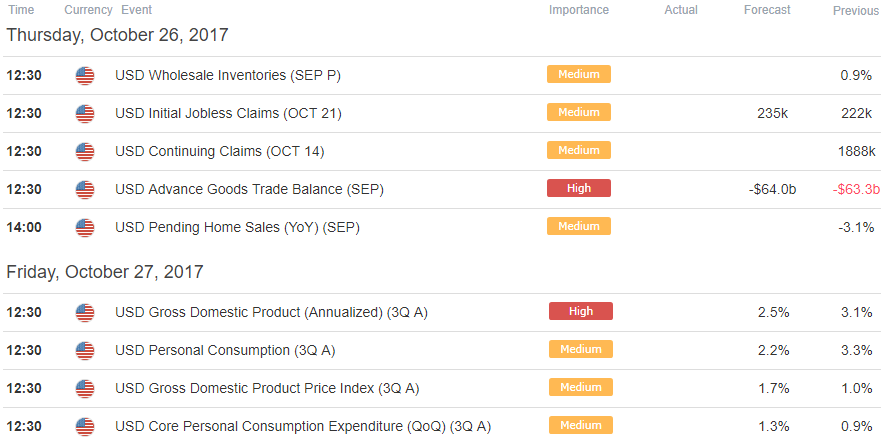
Relevant Data Releases
Check out this week’s DailyFX Webinar Schedule
Other Setups in Play
- USD/CAD Battle Lines Drawn Ahead of Canada CPI
- Weekly Technical Outlook: USD Turn or Burn at Key Resistance
- Crude Oil Price Analysis– Pullback to Offer Opportunity
- USD/CHF Testing Make-or-Break Resistance
- Written by Michael Boutros, Currency Strategist with DailyFX
Follow Michael on Twitter @MBForex or contact him at mboutros@dailyfx.com.


