


Talking Points
- NZDUSD vulnerable heading into U.S. 3Q GDP
- Weekly opening range remains intact- break to validate
- Updated targets & invalidation levels
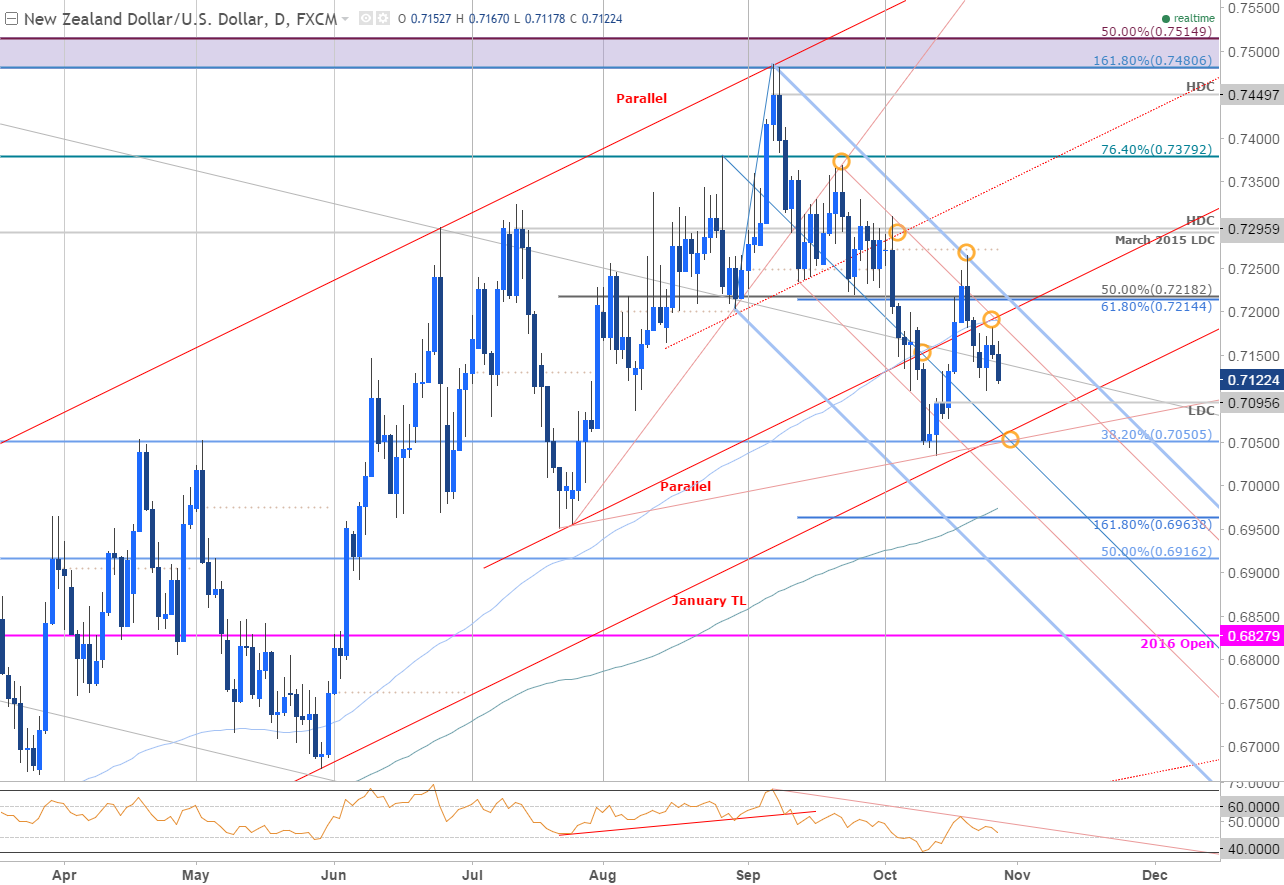
Chart Created Using TradingView
Technical Outlook: NZDUSD has been trading within the confines of a broad descending pitchfork formation extending off the yearly highs. We’ve continued to track this setup on SB Trade Desk with the weekly opening range in focus heading into tomorrow’s U.S. 3Q GDP release. The focus remains lower while sub-7214/18with subsequent targets at the monthly low-day close at 7095 & confluence support into 7050.
NZD/USD 240min
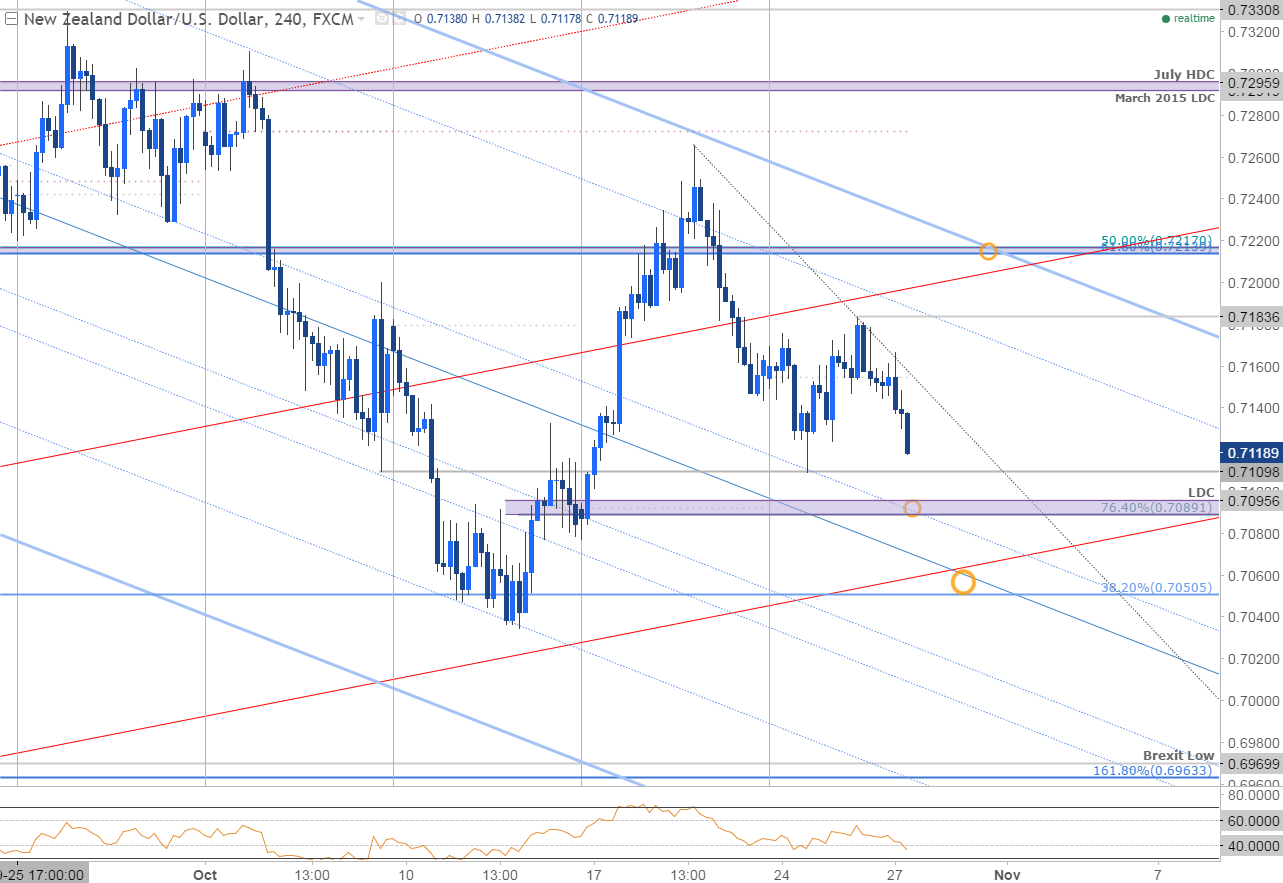
Notes: A closer look at intraday price action highlights a well-defined weekly opening range and we’ll be looking for a break to validate our near-term bearish outlook. A break below key confluence support at 7050 would risk substantial losses for the kiwi with such a scenario targeting a sliding parallel around the 70-handle backed by more significant support at the 6963/70– a region defined by the confluence of the 161.8% extension, the Brexit swing low & parallel support extending off the monthly lows.
Interim resistance stands with a basic trendline extending off last week’s high backed by the weekly opening range high at 7184 & bearish invalidation at 7214/18. From a trading standpoint, I would be looking to fade strength while below the weekly high with a break lower targeting subsequent objectives into structural support. For the complete setup and to continue tracking this trade & more throughout the week- Subscribe to SB Trade Desk.
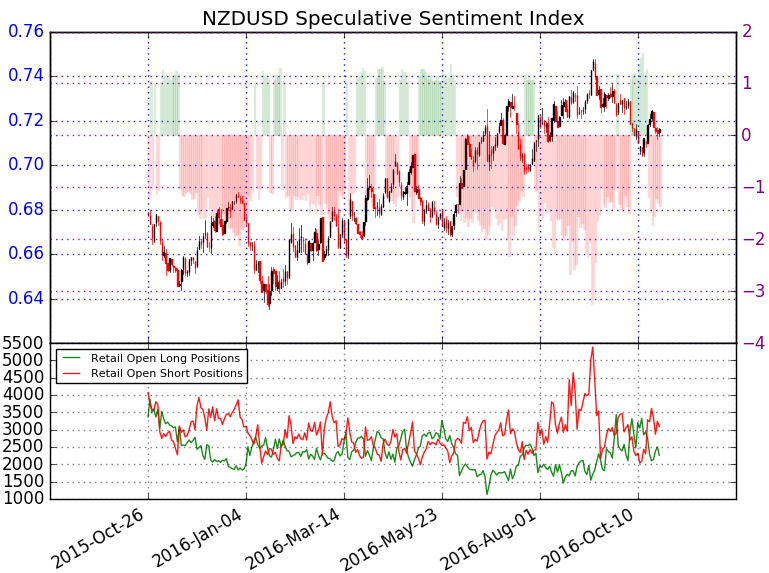
- A summary of the DailyFX Speculative Sentiment Index (SSI) shows traders are net short NZDUSD- the ratio stands at -1.13 (47% of traders are long)- weak bullish reading
- Long positions are 15.9% higher than yesterday and 28.7% above levels seen last week.
- Short positions are 8.9% higher than yesterday and 6.6% below levels seen last week.
- Open interest is 12.1% higher than yesterday and 6.2% above its monthly average
- Although the current dynamic gives a mixed trading bias, the recent build in long positioning alongside a pullback from the extreme read of -1.61 seen earlier in the month suggests that the immediate risk remains to the downside despite the aggregate net-short exposure.
Help fine-tune you entries, click here to learn more about the DailyFX Grid Sight Index (GSI)
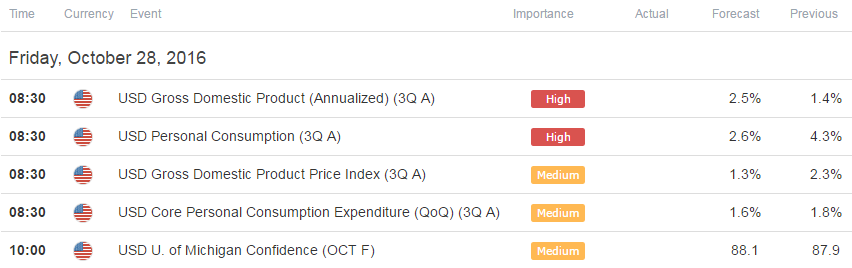
Relevant Data Releases
Other Setups in Play:
- Oil Price Sell-off to Gain Traction on a Break Below 48.80
- AUD/USD Rebound Looks to 3Q Australia CPI for Fuel
- EUR/CAD Rebound or Reversal? Line-in-the-Sand at 1.4600
- Webinar: USD, EUR Back at Yearly Open- US GDP in Focus
Looking for more trade ideas? Review DailyFX’s Top Trading Opportunity of 2016
---Written by Michael Boutros, Currency Strategist with DailyFX
Follow Michaelon Twitter @MBForex contact him at mboutros@dailyfx.com or Click Here to be added to his email distribution list
Join Michael for Live Scalping Webinars on Mondays on DailyFX and Tuesday, Wednesday & Thursday’s on SB Trade Desk at 12:30 GMT (8:30ET)


