


Gold, XAU/USD, US Dollar, Real Yields, Producer Price Index – Talking Points
- Gold prices are steady just above the 1,700 level in Asia-Pacific trading
- A surge in Fed rate hike bets drove anti-gold real yields to multi-year highs
- The US producer price index (PPI) may deliver a crushing blow to bullion

Gold prices are trading just above the 1,700 level after steep overnight losses. A surprise inflation report out of the United States on Tuesday shifted the market’s outlook regarding Fed rate hike bets. The Fed may deliver a 100-basis point rate hike later this month, according to overnight index swaps. That shocked bullion traders, many of whom expected the August CPI number to mark the turning point in the FOMC’s fight against rising prices.
The yellow metal was no match against a US Dollar backed by rising Treasury yields and risk-off capital flows. Gold is now on track to record its sixth straight monthly decline. The most notable headwind is perhaps real yields--the inflation-indexed Treasury rate. Bullion is acutely susceptible to those real yields, as the metal doesn’t pay interest to investors. This morning, the 5-year real yield rose above 1% for the first time since 2018, when gold traded at around 1,280.
Gold (XAU/USD) Weekly Chart
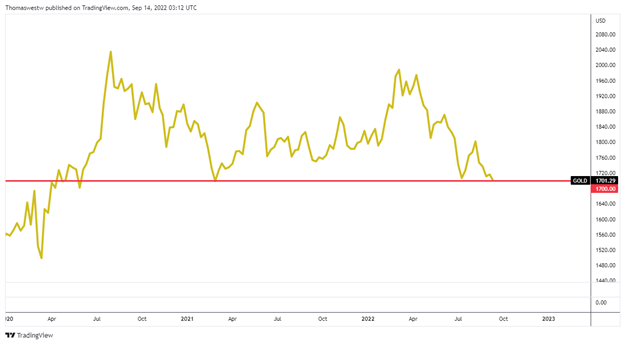
Chart created with TradingView
A break below the 1,700 level would mark a notable event, given its track record of support going back to 2021. Gold traders may abandon the trade and wait for lower prices to reengage a pivot play on the Fed, which appears further out after CPI. A catalyst to break the remaining resolve provided by the psychological level is approaching.
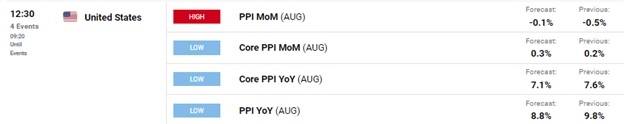
The US producer price index (PPI) for August is due before the New York opening bell. Analysts expect the month-over-month number to show a 0.1% decline from July when the rate dropped 0.5% m/m. The core PPI—a reading that removes food and energy—is seen rising to 0.3% from July. As with the CPI data, an unexpected increase in PPI numbers would do well for Fed rate hike bets and Treasury yields. That would degrade gold’s fundamental stanceand potentially trigger a wave of selling into levels not seen since early 2020.
--- Written by Thomas Westwater, Analyst for DailyFX.com
To contact Thomas, use the comments section below or @FxWestwater on Twitter


