


GOLD PRICE OUTLOOK:
- Gold prices have fully retraced the geopolitical turmoil induced gains from the first quarter
- Rising real yields and strong US dollar momentum have been the two main bearish catalysts for precious metals
- This article examines the key technical levels for XAU/USD to watch in the near term
Trade Smarter - Sign up for the DailyFX Newsletter
Receive timely and compelling market commentary from the DailyFX team
Most Read: US Dollar, Gold, S&P 500 - How Have Markets Reacted to US CPI
Russia's invasion of Ukraine triggered a major rally in gold prices during the first quarter, pushing the metal close to its all-time high near $2,075 per ounce. However, the geopolitical premium seems to have unwound, even though the war in Eastern Europe is not over and continues to drag on almost three months after its outbreak.
Examining the daily chart, we can see that XAU/USD has fully retraced its geopolitical turmoil-induced gains, dropping 11% from its March high to trade slightly above $1,835, an area of confluence support, where the 200-day simple moving average converges with the lower boundary of a medium-term ascending channel.
The recent pullback in the commodity has been prompted by, among other things, the solid U.S. dollar momentum, and more importantly, the rising interest rate environment. For context, the DXY index, a gauge of the greenback strength, has surged more than 6% since April, while the 10-year real yield (TIPS) has turned positive for the first time in more than two years, climbing from -0.53% to 0.20%, the highest level since November 2019.

US 10 YEAR REAL YIELD CHART
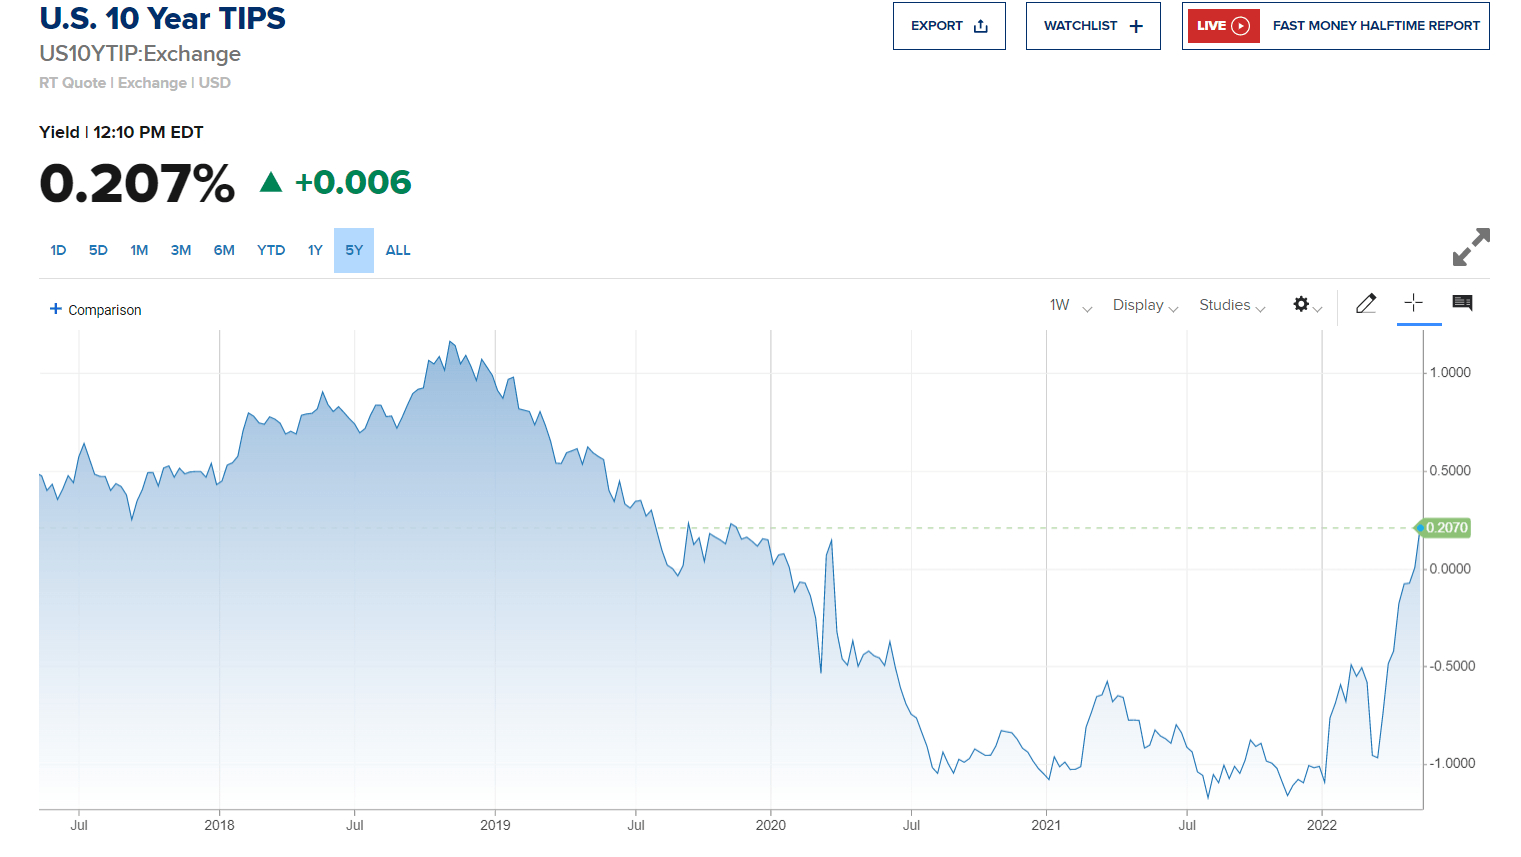
Source: CNBC
Although gold is considered a safe-haven asset, it has not lived up to that reputation of late. In fact, in recent weeks, gold has bizarrely tracked losses in the equity space, rather than bucking the trend of risk assets, a sign that real rate dynamics are far more important to the precious metal than investor sentiment. With real yields expected to continue their ascent on hawkish Fed policy, XAU/USD could face further headwinds in the near term, especially if the recession narrative begins to subside and traders ditch defensive positions.
In terms of technical analysis, XAU/USD is dancing around a major support near $1,835/$1,830, as mentioned earlier. If the bears manage to drive price below this floor decisively, selling interest could gain momentum, setting the stage for a retest of the 2022 low at $1,780. On further weakness, the attention shifts lower to the December 2021 swing low at $1,753.
On the flip side, if buyers regain the upper hand and spark an upswing in price action, initial resistance spans from $1,870 to $1,875. If this barrier is cleared, we can’t rule out a move towards $1,910, followed by $1,960, though the bullish argument is somewhat weak at this point.
| Change in | Longs | Shorts | OI |
| Daily | 3% | -2% | 0% |
| Weekly | 8% | -8% | 0% |
GOLD PRICE TECHNICAL CHART
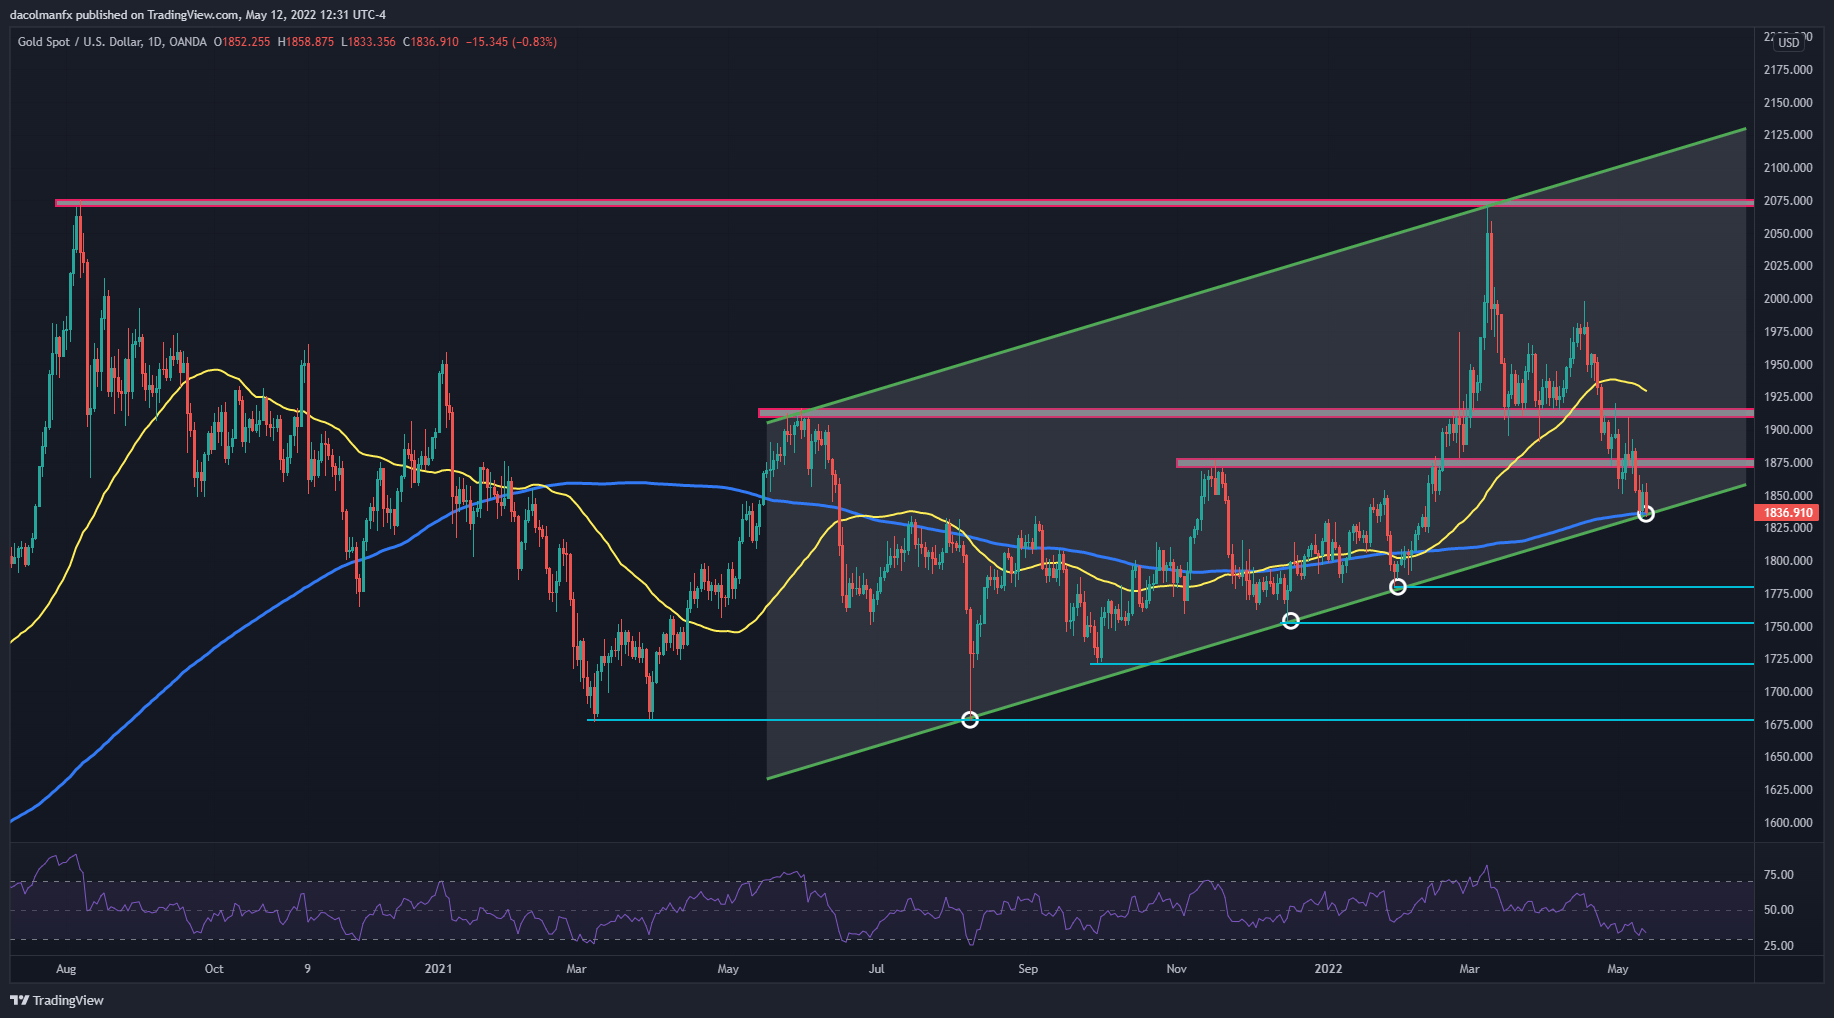
Gold Price Chart Prepared Using TradingView
EDUCATION TOOLS FOR TRADERS
- Are you just getting started? Download the beginners’ guide for FX traders
- Would you like to know more about your trading personality? Take the DailyFX quiz and find out
- IG's client positioning data provides valuable information on market sentiment. Get your free guide on how to use this powerful trading indicator here.
---Written by Diego Colman, Market Strategist for DailyFX


