


Gold, XAU/USD, Trendlines, Bullish Engulfing, Technical Analysis - Talking Points:
- Gold prices aimed higher over the past 24 hours, more to come?
- Daily chart suggests consolidation could be in store medium-term
- Near-term, XAU/USD could be shooting for an upside path ahead

Gold prices aimed higher over the past 24 hours as the yellow metal struggled to breach the 1872 – 1886 support zone that has its beginnings in the middle of February. Broadly speaking, the yellow metal appears to be in an uptrend. This could be defined by rising support from August 2021 on the daily chart below.
In the near term, falling resistance from March seems to be guiding XAU/USD to the downside. This is leaving gold in a situation where it may consolidate ahead between the converging trendlines. Further gains would place the focus on the 38.2% Fibonacci retracement level at 1922 before falling resistance from March starts to kick in.
Conversely, clearing the support zone would place the focus on rising support from August and the 61.8% Fibonacci retracement at 1830. Clearing under the latter would expose the early 2022 low at 1778 before the December 2021 low kicks in at 1753. Still, taking a closer look at a near-term horizon reveals that the yellow metal could aim higher in the coming sessions.
XAU/USD Daily Chart
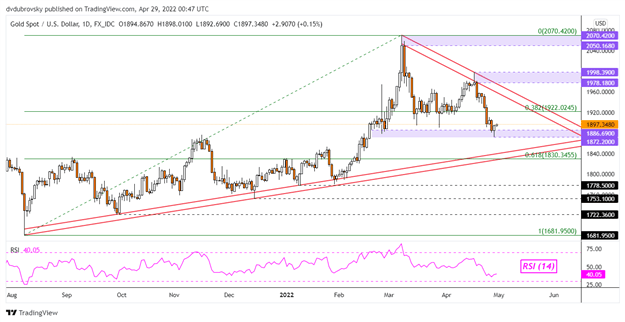
Chart Created Using TradingView
XAU/USD 4-Hour Chart
On the 4-hour chart, gold prices have confirmed a Bullish Engulfing candlestick pattern as XAU/USD tested the 1872 – 1886 support zone. This also followed positive RSI divergence, which showed fading upside momentum. Prices could break above the 20-period Simple Moving Average (SMA), exposing the 50-period line. That could hint at near-term gains to come. Such an outcome would place the focus on the 38.2% and 61.8% Fibonacci retracements at 1920 and 1949 respectively.

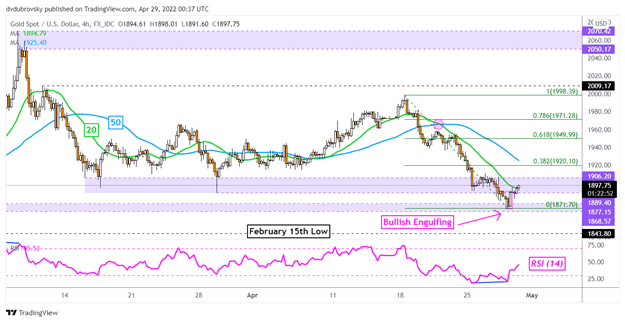
Chart Created Using TradingView
Gold IG Client Sentiment Analysis – Mixed
Looking at IG Client Sentiment (IGCS), about 81% of retail traders are net-long gold. IGCS tends to function as a contrarian indicator. Since the majority of traders are biased to the upside, this suggests that prices may continue falling. However, upside exposure has decreased by 1.73% compared to yesterday. Meanwhile, long bets rose by 1.19% from last week. The combination of overall positioning and recent changes in directional bets are offering a mixed trading bias.
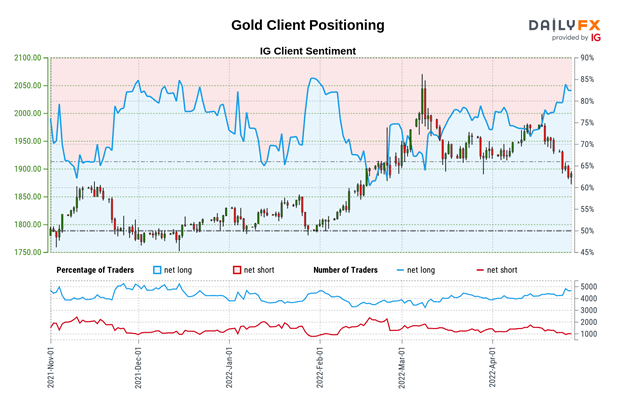
*IGCS data used from April 28th report
--- Written by Daniel Dubrovsky, Strategist for DailyFX.com
To contact Daniel, use the comments section below or @ddubrovskyFX on Twitter
Trade Smarter - Sign up for the DailyFX Newsletter
Receive timely and compelling market commentary from the DailyFX team


