


CRUDE OIL OUTLOOK:
- Crude oil prices stalling as markets digest FOMC policy evolution
- Technical positioning hints that upside momentum may be ebbing
- US PCE inflation data in the spotlight, another 30-year high seen
Crude oil prices idled amid a broad-based lull across benchmark assets as markets continue to reckon with the aftermath of last week’s momentous FOMC policy announcement. WTI initially fell amid broad-based risk aversion as traders worried about sooner-than-expected stimulus withdrawal only to recover that lost ground early this week as comments from Fed officials signaled a lively two-way debate is underway.
Today’s standstill probably reflects a cautious mood ahead of the next key juncture in this story – the release of May’s US PCE inflation data. The core gauge excluding volatile items like food and energy is expected to put price growth at 3.4 percent on-year, the highest in 30 years. That’s up from the 3 percent recorded in April, itself a three-decade peak.
Analogous metrics have pointedly overshot analysts’ forecasts recently, suggesting another upside surprise may be in the cards. Such an outcome may re-energize Fed tightening speculation, weighing on cyclical assets andboosting the US Dollar. That may bode doubly ill for crude oil considering it is quoted in USD terms on global financial markets.

CRUDE OIL TECHNICAL ANALYSIS
Negative RSI divergence points to ebbing upside momentum, which may precede a crude oil downturn from resistance at 74.42 (50% Fibonacci expansion). Initial support is at 70.30 (38.2% Fib), with a break below that exposing the 66.76-68.00 zone. Alternatively, a push above resistance probably opens the door for a challenge of the next upside barrier at 78.47 (61.8% expansion).
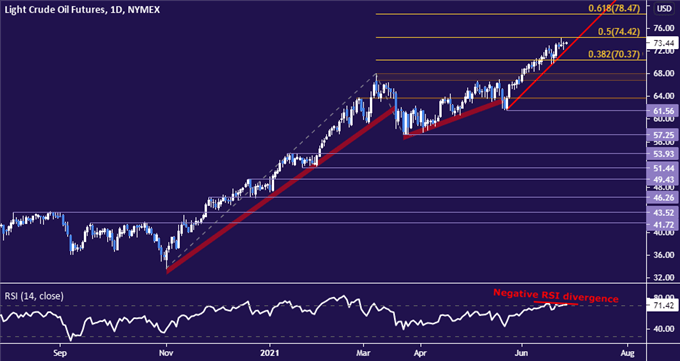
Crude oil price chart created using TradingView
CRUDE OIL TRADING RESOURCES
- What is your trading personality? Take our quiz to find out
- See our guide to build confidence in your trading strategy
- Join a free live webinar and have your questions answered
--- Written by Ilya Spivak, Head Strategist, APAC for DailyFX
To contact Ilya, use the comments section below or @IlyaSpivak on Twitter


