


Crude Oil, Gold, OPEC, IEA, Commodities Briefing – Talking Points:
- Crude oil ends 8-day winning streak as IEA, OPEC cut demand outlook.
- Gold slips on better-than-expected US jobless claims figures.
- Stimulus progress will likely determine the short-term trajectory of both commodities.
Crude oil ended its longest winning streak in two years overnight, after both the International Energy Agency (IEA) and Organization of the Petroleum Exporting Countries (OPEC) slashed their respective global demand outlooks. The IEA cut its forecast for oil consumption in 2021 by 200,00 barrels a day, stating that “renewed lockdowns, stringent mobility restrictions and a rather slow vaccine rollout in Europe have delayed the anticipated rebound”. OPEC also warned that global demand will rebound slower than previously thought.
However, both organizations continue to remain positive on the longer-term outlook for oil, with the IEA’s oil market division head, Toril Bosoni, stating that “we’re seeing that the outlook for the economy and oil demand in 2021 is looking brighter, despite the near-term weakness because of coronavirus”. Indeed, backwardation of the oil futures curve hints at further upside for crude prices in the coming weeks.
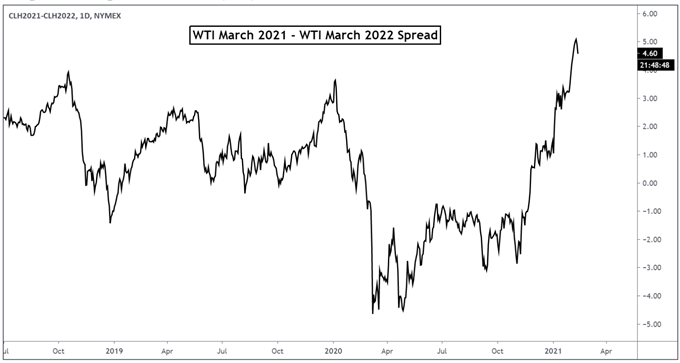
Oil futures curve created using Trading view
Meanwhile, gold prices fell just under 1% overnight, as better-than-expected jobless claims data appeared to diminish the argument for additional fiscal support. That being said, with House and Senate Democrats filing joint budget resolutions that will allow President Biden to pass the majority of his proposed $1.9 trillion stimulus package, gold’s downturn could prove short-lived.
The Federal Reserve’s dovish stance, and falling real rates of return, are also likely to underpin bullion. Fed Chair Jerome Powell reiterated that it is extremely unlikely that the central bank “even think about withdrawing policy support” in the foreseeable future. The upcoming economic docket is fairly light, with consumer sentiment out of the US a notable highlight. Fiscal aid developments will likely dictate the near-term trajectory of both commodities, with a weaker US Dollar probably limiting their respective potential downsides.
Gold Price Daily Chart – Perched Above Key Range Support
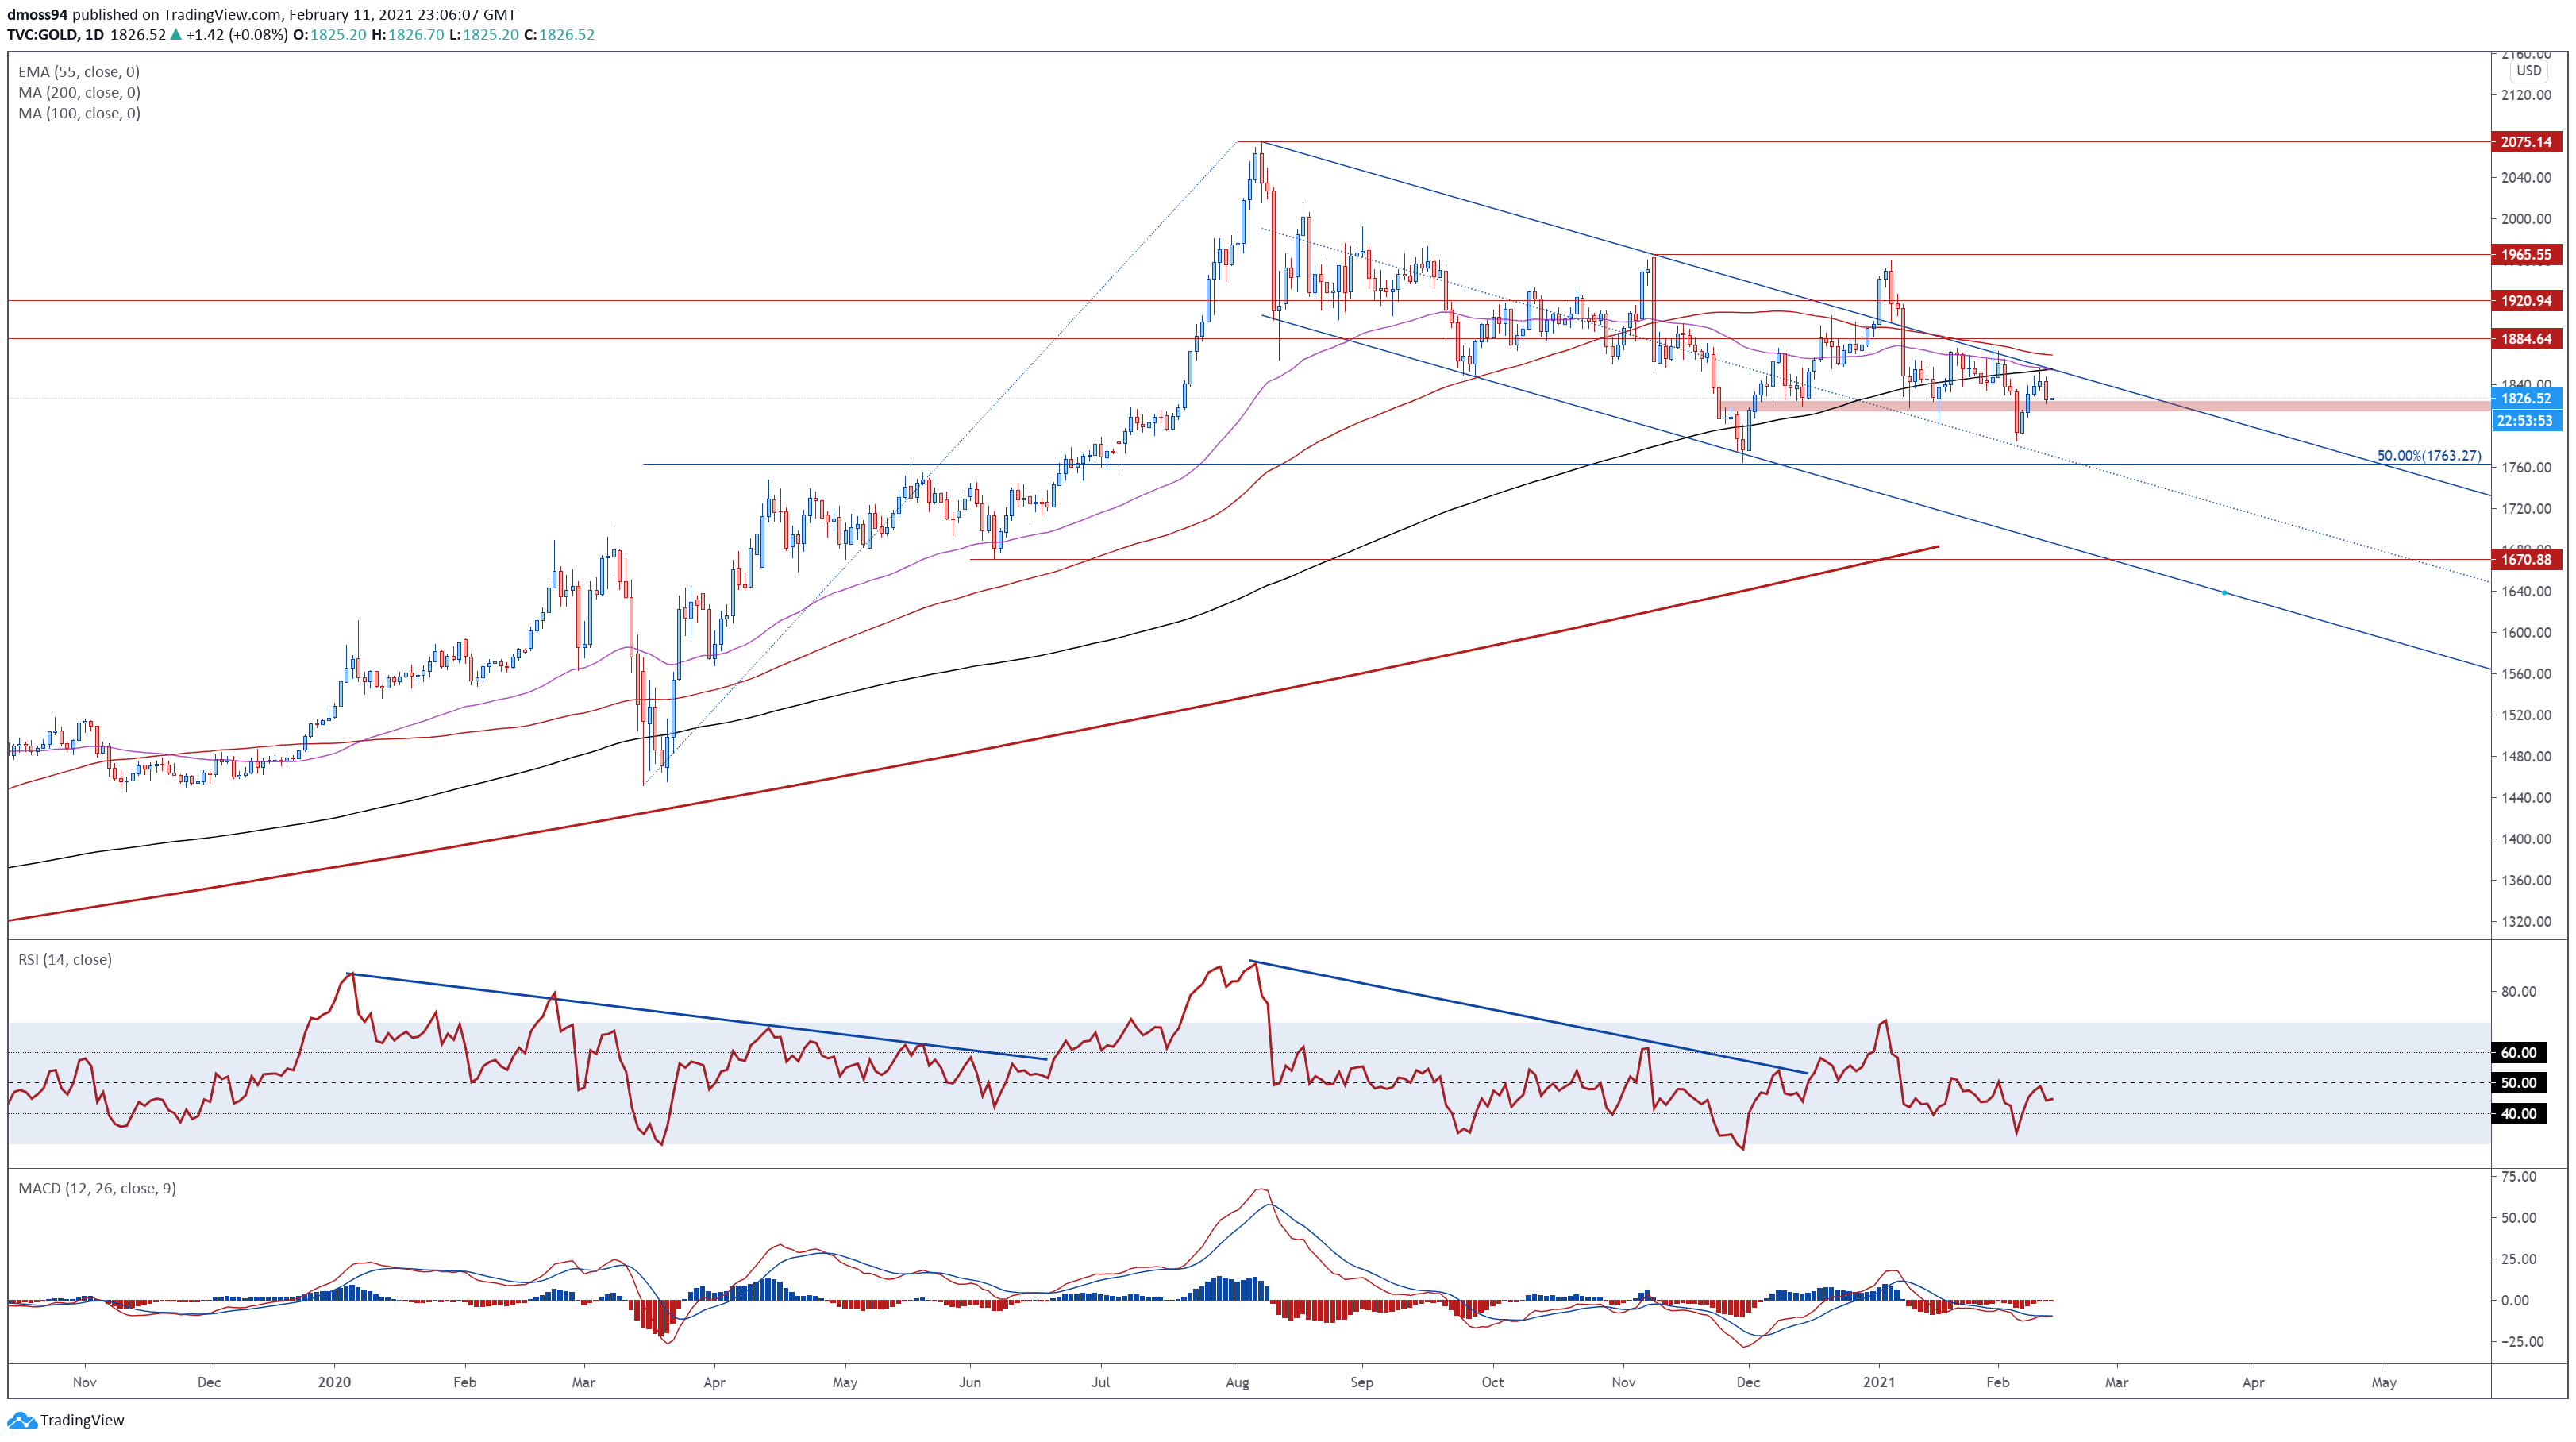
Gold price daily chart created using Tradingview
From a technical perspective, gold is looking to extend its rebound from its lowest levels in two months, as price remains constructively perched above range support at 1815 – 1825.
However, with price still tracking below the sentiment-defining 200-day moving average (1855), and both the RSI and MACD travelling below their respective neutral midpoints, further losses are hardly out of the question.
Nevertheless, a daily close above the 55-EMA (1854) would probably pave the way for prices to make a run at the psychologically imposing 1900 mark. Clearing that brings the yearly high (1959) into focus.
Alternatively, a convincing push back below 1815 could trigger a retest of the monthly low (1785).
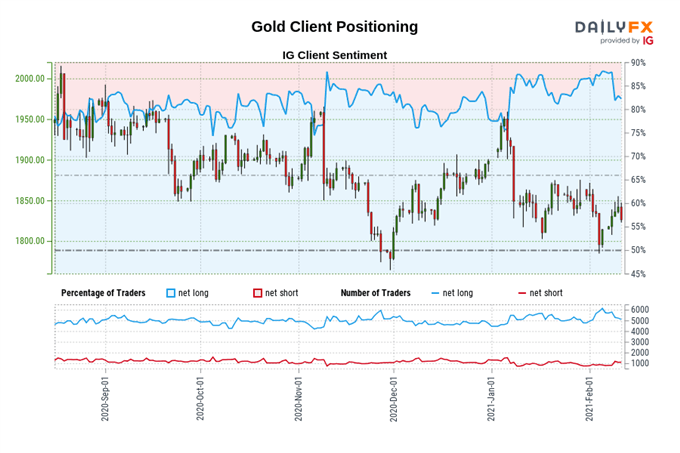
The IG Client Sentiment Report shows 81.43% of traders are net-long with the ratio of traders long to short at 4.39 to 1. The number of traders net-long is 1.17% lower than yesterday and 14.60% lower from last week, while the number of traders net-short is 7.71% higher than yesterday and 41.81% higher from last week.
We typically take a contrarian view to crowd sentiment, and the fact traders are net-long suggests Gold prices may continue to fall.
Yet traders are less net-long than yesterday and compared with last week. Recent changes in sentiment warn that the current Gold price trend may soon reverse higher despite the fact traders remain net-long.
Crude Oil Daily Chart – Short-Term Pullback on the Cards
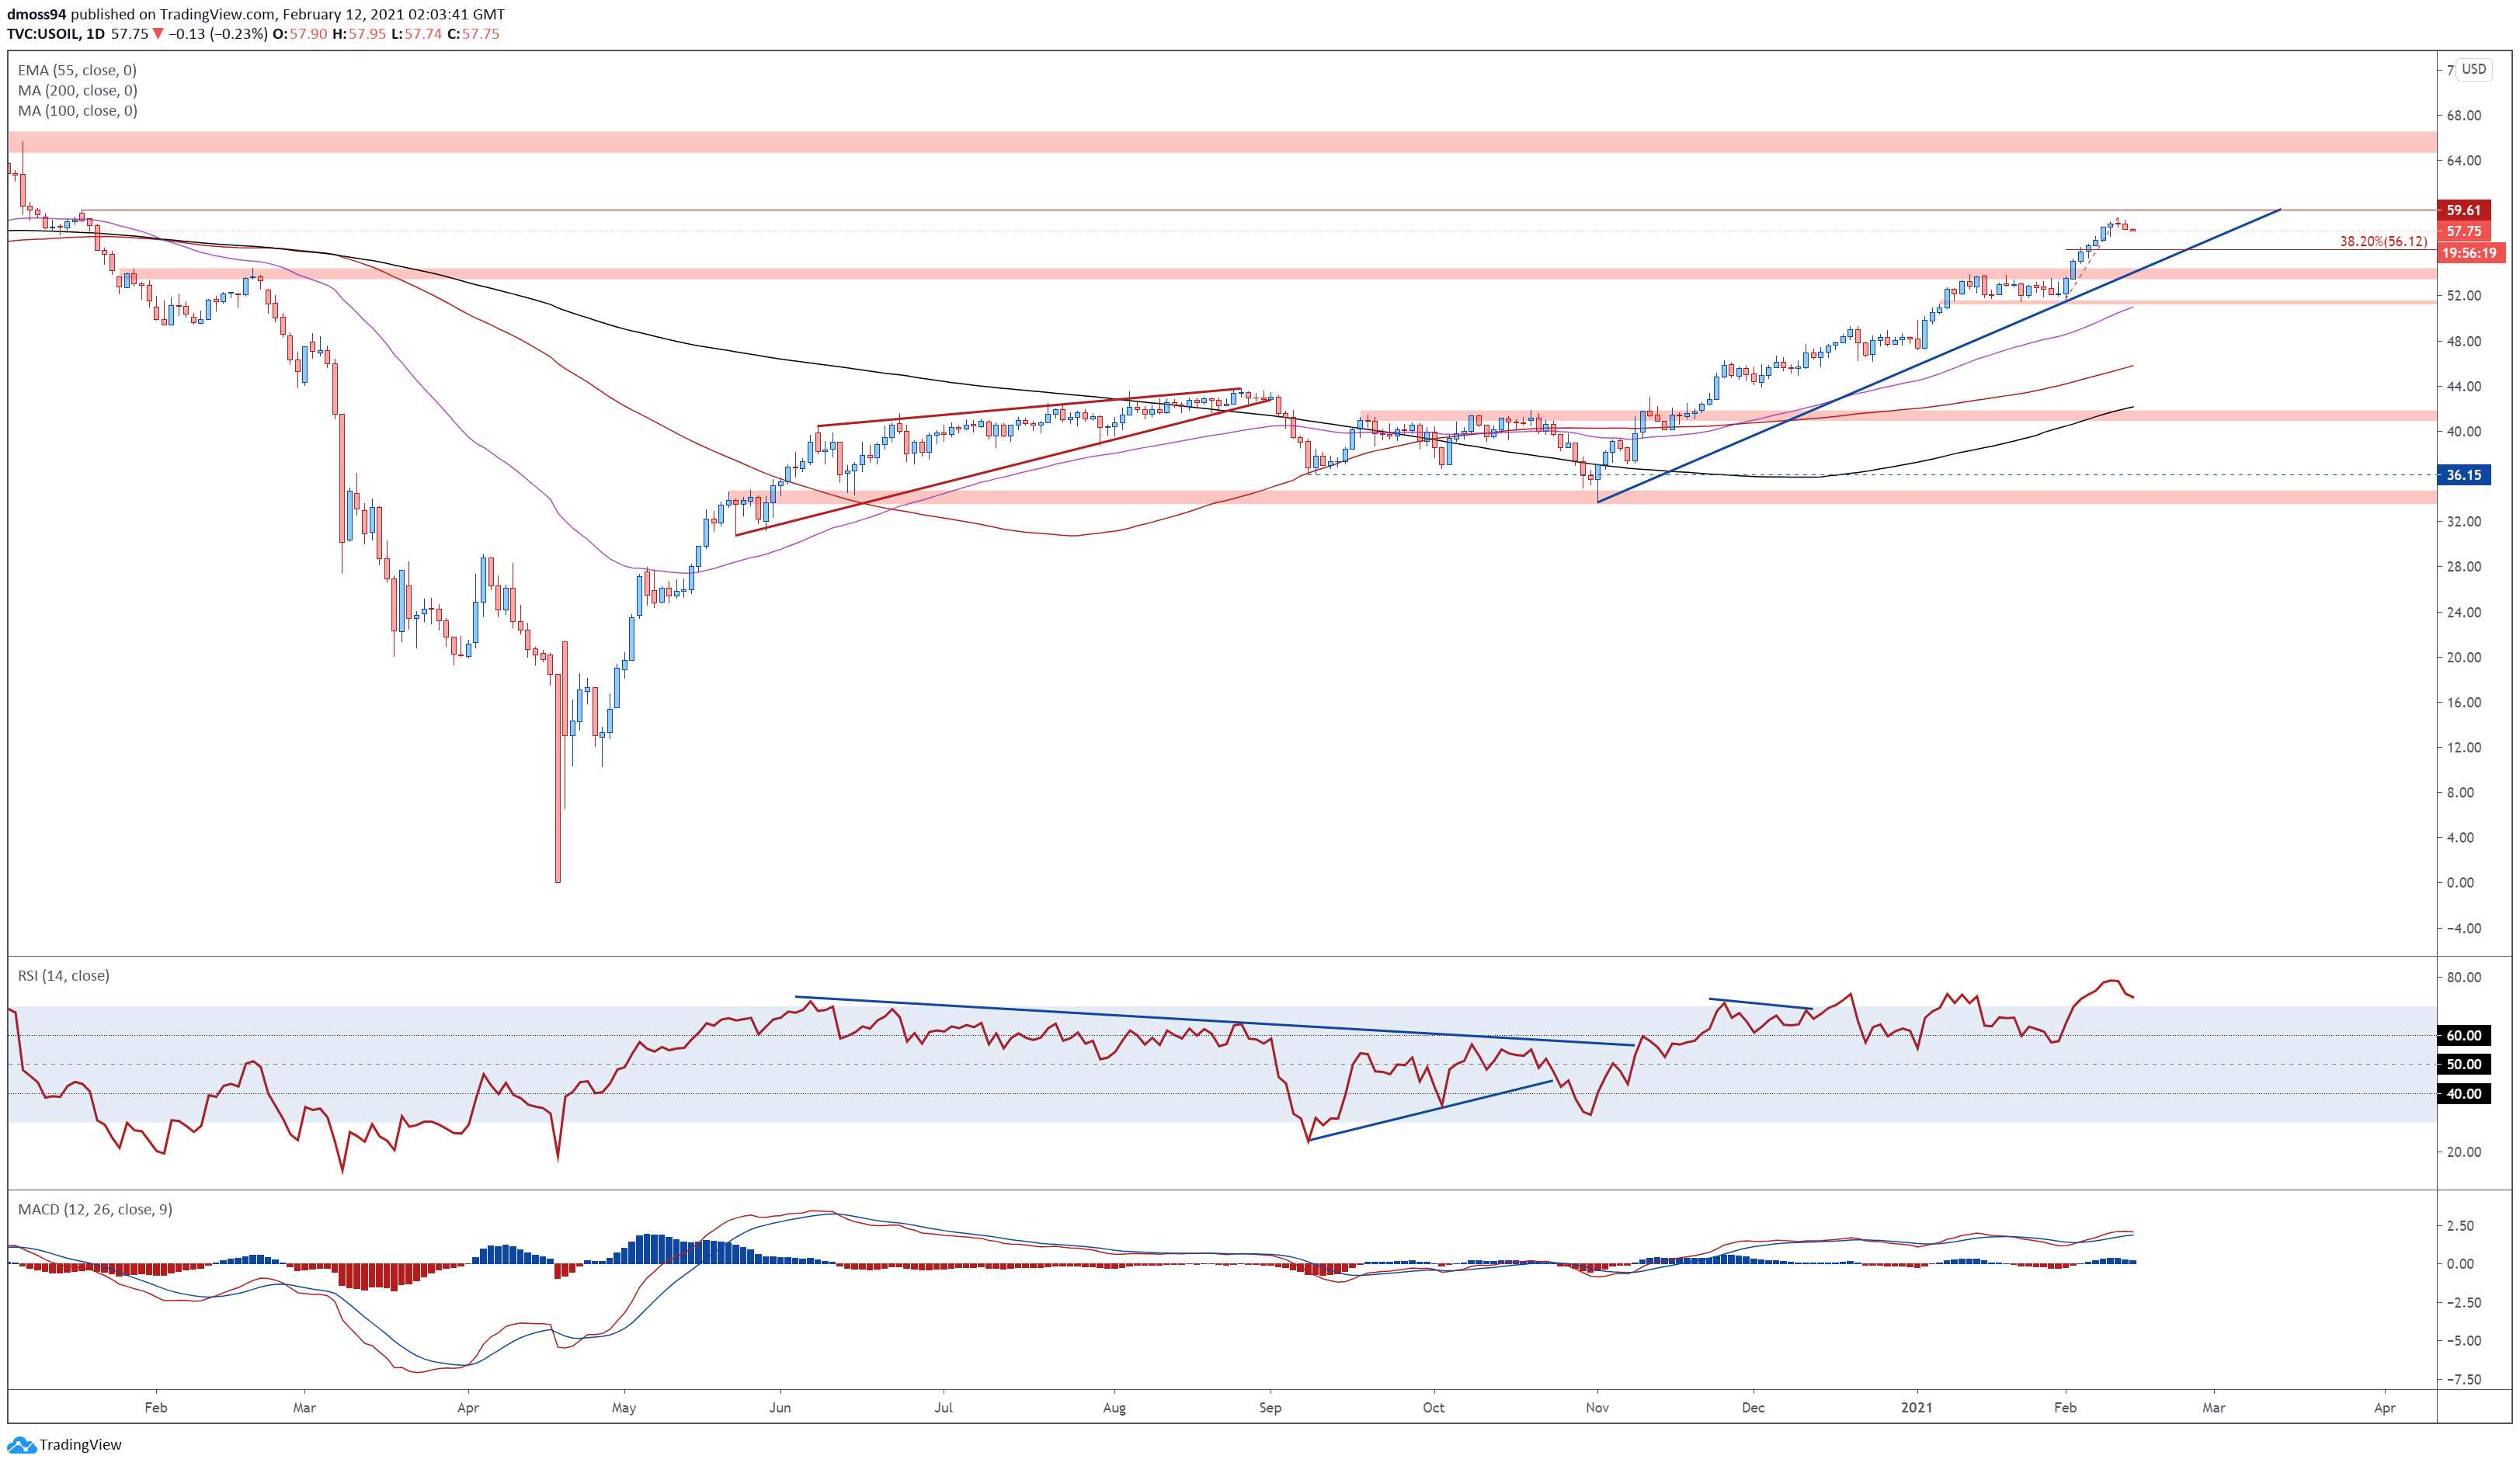
Crude oil daily chart created using Tradingview
Crude oil seems at risk of a near-term pullback, as prices fail to gain a firm foothold above the psychologically pivotal 58.00 level.
However, with the RSI tracking firmly in overbought territory, and prices continuing to travel above all three moving averages, the long-term outlook remain skewed to the upside.
That being said, a break below 57.00 would probably trigger a pullback to the 38.2% Fibonacci (56.12). Breaching that likely paves the way for sellers to drive oil prices back to confluent support at the uptrend extending from the November low and January high (53.90).
Ultimately, a daily close above 59.60 is required to signal the resumption of the primary uptrend and clear a path for price to challenge the 2020 high (65.62).
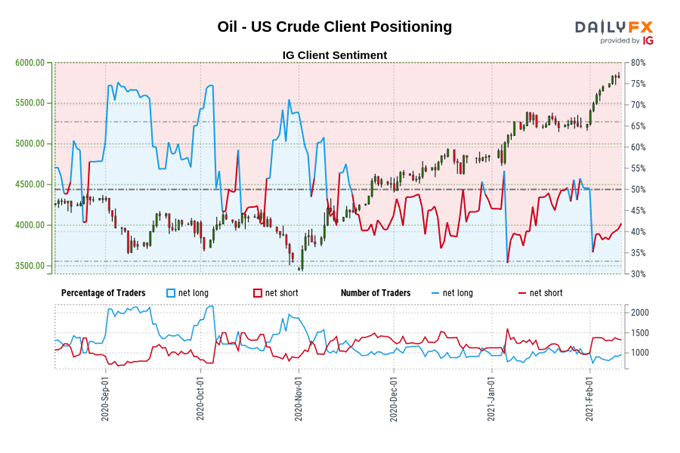
The IG Client Sentiment Report shows 42.52% of traders are net-long with the ratio of traders short to long at 1.35 to 1. The number of traders net-long is 5.03% higher than yesterday and 12.70% higher from last week, while the number of traders net-short is 0.07% higher than yesterday and 2.24% lower from last week.
We typically take a contrarian view to crowd sentiment, and the fact traders are net-short suggests Oil - US Crude prices may continue to rise.
Yet traders are less net-short than yesterday and compared with last week. Recent changes in sentiment warn that the current Oil - US Crude price trend may soon reverse lower despite the fact traders remain net-short.
-- Written by Daniel Moss, Analyst for DailyFX
Follow me on Twitter @DanielGMoss


