


Crude Oil, Economic Recovery, Copper, Technical Forecasts – Talking Points
- Crude Oil pushes into fresh yearly highs after OPEC+ holds production cuts
- EIA inventory figures point to bullish recovery as US economy recovers
- Copper prices in danger as Descending Triangle pattern sends bearish signal

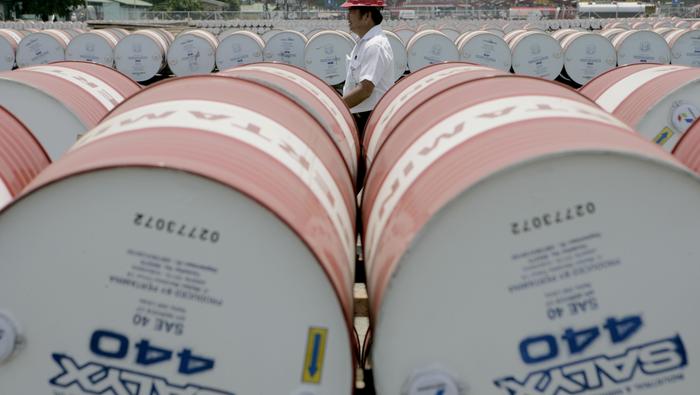
Oil prices are surging this week on declining inventory levels, OPEC+ developments, and an improving global economic outlook. U.S. benchmark West Texas Intermediate (WTI) prices rose above the 56 handle for the first time since last January. Increased stimulus bets have also bolstered prices as Democrats on Capitol Hill continued progress towards passing a massive $1.9 trillion fiscal relief package. Along with oil prices, markets are reflecting optimism in fiscal stimulus bets through the 10-year Treasury yield as investors move away from the safety of US government bonds.

Crude oil prices climbed nearly 8% so far this month following an 8.28% gain in January. Tightening supply levels have helped lift the commodity as Covid-induced economic restrictions continued to ease across major economies. The US Energy Information Administration’s petroleum report for the week ending January 29 showed a 994k crude oil inventory draw. Analysts were forecasting a build of 446k, according to the DailyFX Economic Calendar.
OPEC+ kept its oil output policy unchanged on February 3 after its meeting of the Joint Ministerial Monitoring Committee (JMMC) concluded. A press release statement noted that compliance with production adjustments remain high among participating countries. Moreover, the statement also praised falling inventory levels in OECD countries but cautioned that the outlook remains uncertain.

While a question mark continues to hang over the global economic recovery, the distribution of vaccines have injected a broad sense of optimism through the global investing community. Still, a broad recovery remains far from certain, with vaccine distribution hurdles posing a potentially significant risk to an already fragile global economy.
Europe is one area already facing problems as governments struggle to coordinate and secure adequate vaccine supplies. Tomas Dvorak, an economist at Oxford Economics, told the New York Times that, “There is definitely a risk that vaccine distribution continues to be disappointing.” The Eurozone faces a double-dip recession after troubling economic data points to a second consecutive quarter of economic contraction.
Crude Oil Technical Forecast
Crude oil has extended above the psychologically important 56 handle as bulls drove prices higher. A trendline formed from the 2018 high may provide some resistance near the current level. The Relative Strength Index (RSI) is also flashing an overbought signal, but momentum may continue driving prices higher. Further upside is supported by the MACD crossing above its signal line. A drop down to the 20-day Simple Moving Average – which has supported price action since last November – may offer an area for prices to consolidate before the next push higher.
Crude Oil Daily Chart
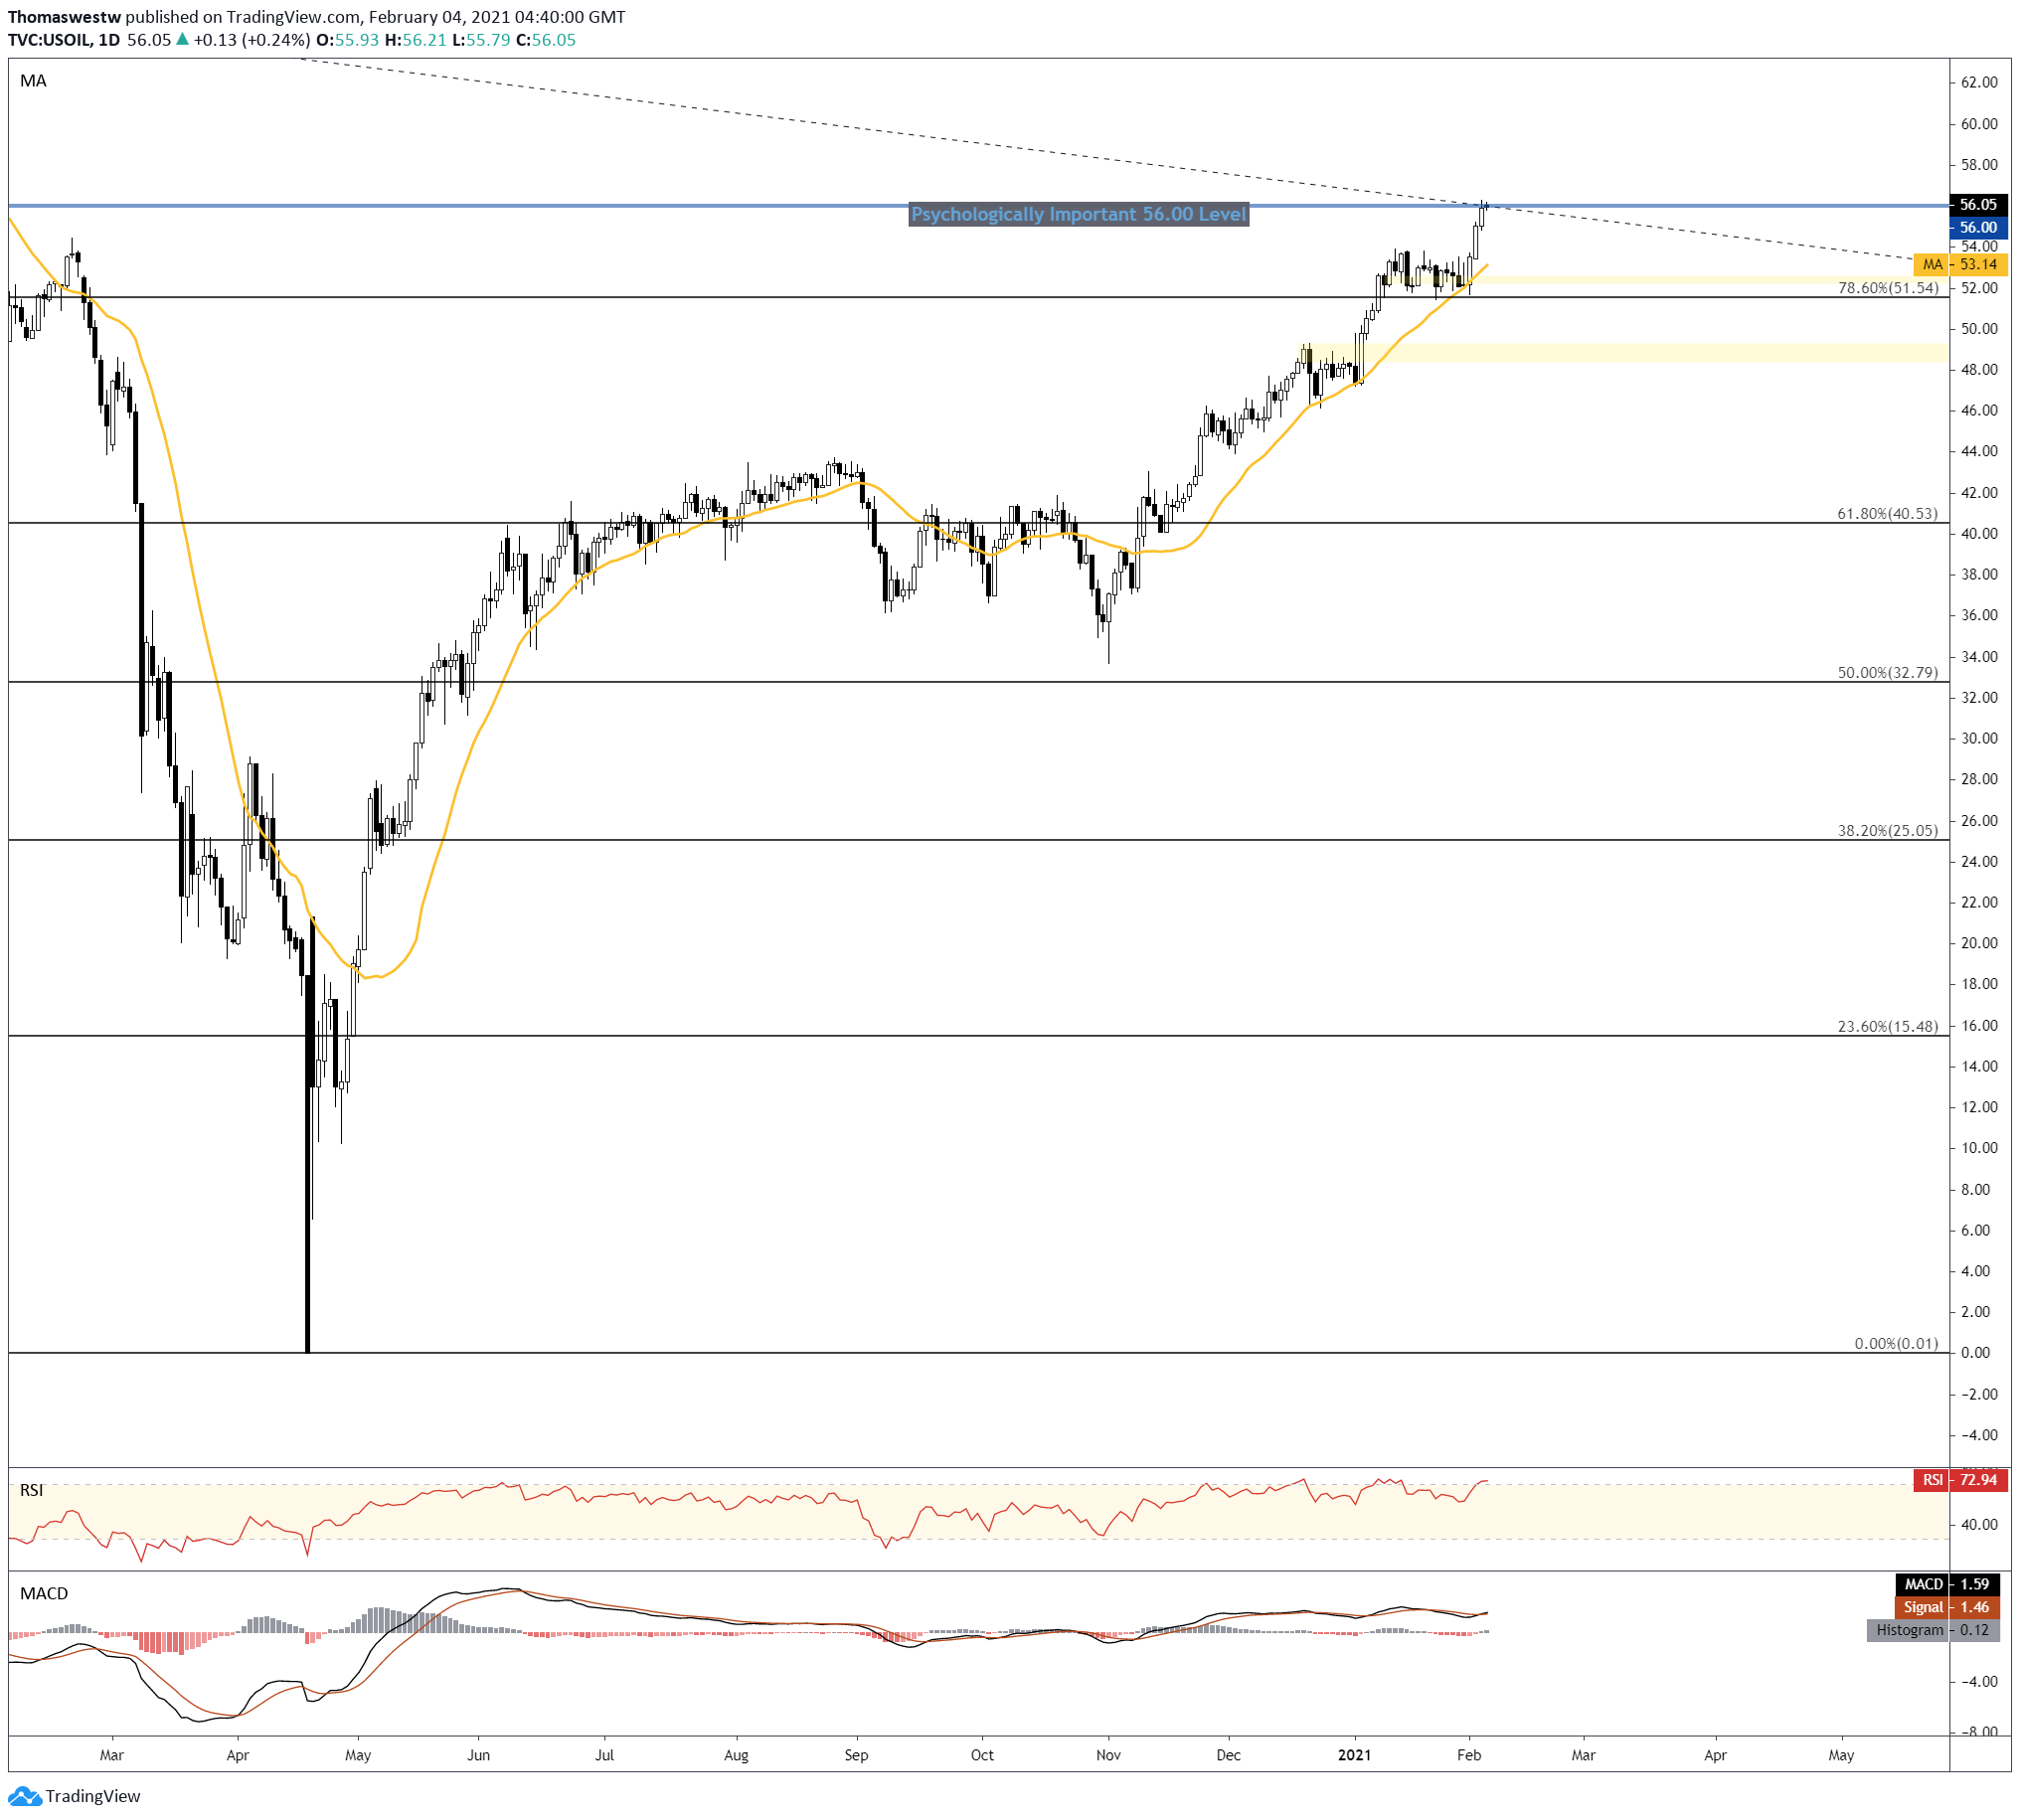
Chart created with TradingView
Copper Technical Forecast
Copper prices have stalled since reaching new multi-year highs in early January. Since then a series of lower highs has developed the upper bound of a Descending Triangle. The 50-day SMA appears to be underpinning prices, but another test of the triangle’s horizontal support level could see prices breakdown if breached. To the upside, the descending trendline channel will need to be overtaken for a chance to make fresh highs.
Copper 4-Hour Chart

Chart created with TradingView
Oil, Copper TRADING RESOURCES
- Just getting started? See our beginners’ guide for FX traders
- What is your trading personality? Take our quiz to find out
- Join a free webinar and have your trading questions answered
--- Written by Thomas Westwater, Analyst for DailyFX.com
To contact Thomas, use the comments section below or @FxWestwater on Twitter


