


Crude Oil, Gold, XAU/USD, Capitol Hill, Georgia Senate Runoffs - Talking Points:
- Crude oil prices rallied alongside equities despite temporary Capitol Hill lockdown
- Gold prices weakened amid a strong performance in longer-dated Treasury yields
- Georgia Senate runoffs have opened the door to more fiscal stimulus in near-term

Growth-linked crude oil prices rallied over the past 24 hours, climbing alongside equities despite a temporary lockdown on Capitol Hill that disrupted the certification of the US presidential election. The Dow Jones Industrial Averaged wrapped up Wednesday with a 1.44% gain, though trimming some of its progress as civil unrest erupted in Washington D.C.
Anti-fiat gold prices on the other hand declined 1.62%, the most in almost 2 months. The haven-linked US Dollar traded flat. What likely drove weakness in XAU/USD was a 6.48% rally in 30-year Treasury yields, the most since December 1st. Rising yields from fixed-income investments tend to bode ill for the yellow metal. It is not an income-generating asset, investors rely solely on its appreciation to make a profit.

What seemed to largely drive market mood on Wednesday was the outcome of Georgia’s Senate runoffs. The two Democratic contenders likely won, netting a 50-50 split in the Senate with Vice President-elect Kamala Harris to act as a tie-breaking vote. This has raised prospects of larger-than-expected fiscal stimulus, opening the door to continued economic recovery, likely pushing up longer-dated Treasury yields.
With futures tracking Wall Street and most APAC indices in the green, crude oil prices may continue climbing over the next 24 hours. However, gains in government bond yields could keep gold at bay for the time being as Congress is poised to certify election results. Keep a close eye on US jobless claims and ISM services data. A rosy outcome in the latter following similar upbeat manufacturing prints could compound a ‘risk-on’ tone.
Check out the DailyFX Economic Calendar for updates on these outcomes
Crude Oil Technical Analysis
WTI crude oil prices confirmed a break above the early February 2020 inflection point at 49.42, exposing the peak in the same month at 54.45 as key resistance. Meanwhile, a bullish ‘Golden Cross’ is underpinning the case to the upside, with the 20-day and 50-day Simple Moving Averages in focus for key support levels. Negative RSI divergence hints that upside momentum is fading however.
WTI Crude Oil Daily Chart
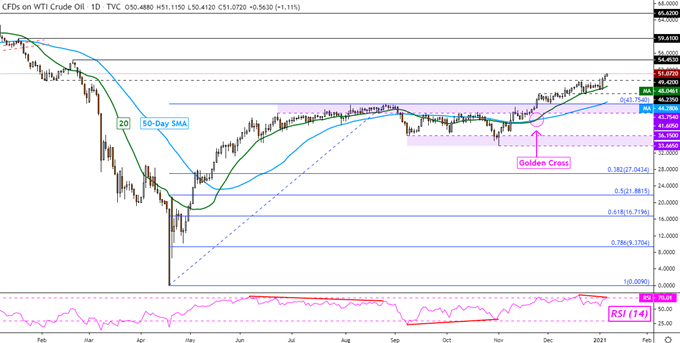
Chart Created Using TradingView
Gold Technical Analysis
Gold prices declined and paused declines on the near-term rising trendline from late November over the past 24 hours. Moreover, the push above key falling resistance from August held, maintaining an upside bias. Here too a ‘Golden Cross’ is supporting the case to the upside after recently forming. In the event of a turn lower, the 20-day and 50-day SMAs may hold as key support.

XAU/USD Daily Chart
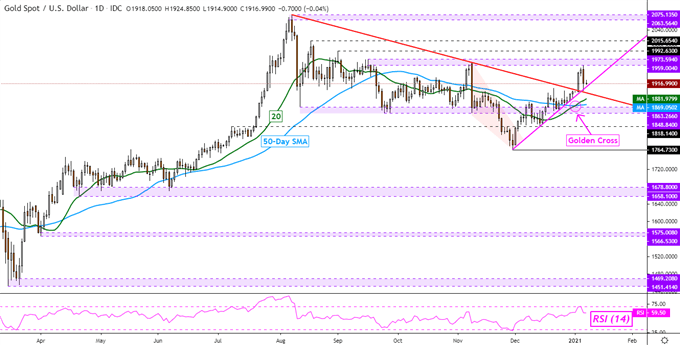
Chart Created Using TradingView
--- Written by Daniel Dubrovsky, Currency Analyst for DailyFX.com
To contact Daniel, use the comments section below or @ddubrovskyFX on Twitter


