


Gold, XAU/USD, Crude Oil, Covid Vaccine, US Sentiment Data, Technical Analysis - Talking Points:
- Gold was unable to capitalize on weaker USD, Treasury yields
- Crude oil prices rose, enjoying vaccine optimism, China demand
- XAU/USD may be at a turning point, WTI momentum is fading
Anti-fiat gold prices traded relatively flat on Thursday despite what typically tends to be a bullish scenario for the yellow metal, signaling underlying weakness. Both the US Dollar and Treasury yields were down for the day, with declines in the former usually beneficial to commodity prices. Growth-linked copper closed at the highest since February 2013 as demand from China boosted iron ore futures.
Crude oil prices also soared, pushing to the highest since early March in the aftermath of bullish technical signals I pointed out last week. WTI futures backwardation, where the January 2021 contract is above the 2022 one, continues to hint at strong near-term demand. This is coupled with the supply-side implications of last week’s OPEC+ cut tapering program for next year.
Over the past 24 hours, the US Food and Drugs Administration (FDA) gave the green light for Pfizer’s coronavirus vaccine distribution, raising prospects for oil demand as people slowly resume traveling. Energy prices may have also received a boost from Chinese private demand as refiner Luqing Petrochemical bought about 6 million barrels for the first three months of next year.

Ahead, crude oil and gold prices are eyeing preliminary US University of Michigan Sentiment data where the survey is expected to dip to 76.0 in December from 76.9 prior. A disappointing outcome could dampen recent gains in oil, especially with ongoing fiscal stimulus talks in a stalemate. If the anti-risk US Dollar also receives a bid, then we may see XAU/USD unwind recent gains.
Gold Technical Analysis
Gold is appearing to lose momentum following the breakout and subsequent confirmation of a bullish ‘Falling Wedge’ on the daily chart below. While XAU/USD pushed above the short-term 20-day Simple Moving Average (SMA), the medium-term 50-day one held as key resistance. This has re-centered the focus on the bearish implications of a ‘Death Cross’ formed back in September. Also, the former 1848 – 1863 support zone held as new resistance. A push under 1818 could see gold descend to the November low.
| Change in | Longs | Shorts | OI |
| Daily | -2% | -2% | -2% |
| Weekly | 3% | 16% | 10% |
XAU/USD Daily Chart
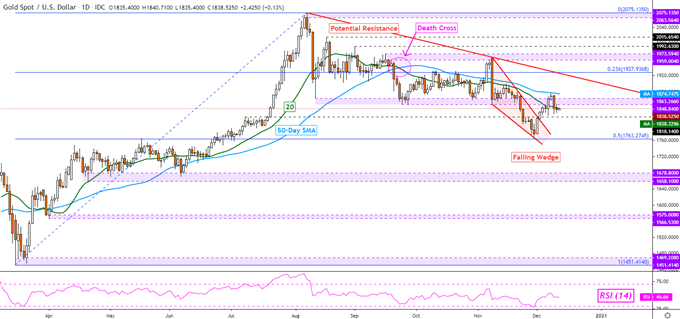
Chart Created Using TradingView
Crude Oil Technical Analysis
WTI crude oil prices closed above resistance at 46.24, exposing the early February inflection point at 49.42. However, negative RSI divergence shows that upside momentum is fading. As such, traders ought to proceed with caution. A turn lower places the focus on the 20-day and 50-day SMAs, which recently formed a bullish ‘Golden Cross’ in early November. Confirming the push above resistance could open the door to further gains.
| Change in | Longs | Shorts | OI |
| Daily | -2% | -7% | -3% |
| Weekly | 20% | -25% | 3% |
WTI Crude Oil Daily Chart
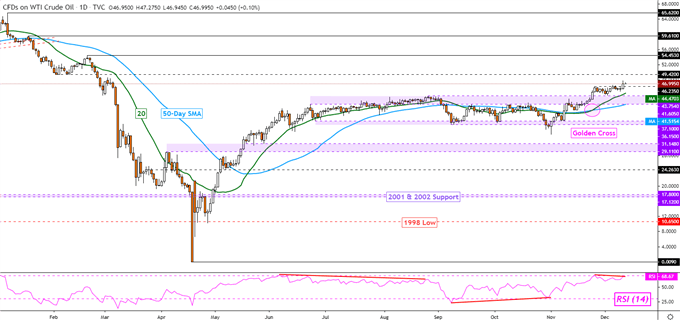
Chart Created Using TradingView
--- Written by Daniel Dubrovsky, Currency Analyst for DailyFX.com
To contact Daniel, use the comments section below or @ddubrovskyFX on Twitter


