


CRUDE OIL & GOLD TALKING POINTS:
- Crude oil prices seesaw on Iraq oil well attack, EIA inventory data
- Technical positioning warning that a downturn may be in the works
- Gold prices plunge as the US Dollar gains, US CPI report in focus
Crude oil prices are struggling to find lasting direction cues. An upswing early in yesterday’s trading session following reports of a militant attack on two oil wells in Iraq’s oil-rich Kirkuk area was promptly erased in the wake of shocking set of EIA inventory figures.
The report showed that inventories surged by an eye-watering 15.2 million barrels last week, smashing forecasts calling for an 849.3k-barrel draw. A bearish surprise was telegraphed in the prior day’s API report, but the scale of this disappointment paled in comparison to that outcome.
A broader selloff was tellingly absent however even as this data was compounded by a broadly risk-off backdrop, which might have been expected to weigh on typically sentiment-sensitive energy prices. The WTI benchmark finished the day little-changed.
CRUDE OIL TECHNICAL ANALYSIS
Crude oil prices continue to idle near the $46/bbl figure, with negative RSI divergence warning that upside momentum is fading. That may precede a downturn, with a daily close below 41.46 exposing the 34.64-36.15 area. Immediate resistance is clustered near the $50/bbl figure.
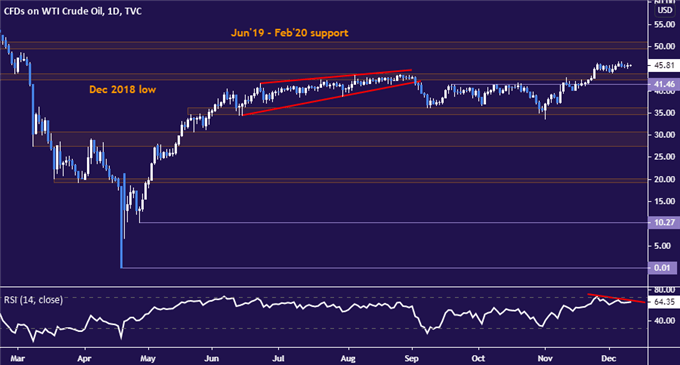
Crude oil price chart created using TradingView

GOLD PRICES MAY FIND A LIFELINE IN US CPI DATA
Gold prices fell as fizzling risk appetite drove the haven US Dollar higher, undermining the appeal of anti-fiat alternatives epitomized by the yellow metal. Cooling US fiscal stimulus hopes and a tech sector selloff following news of an antitrust suit against Facebook seemed to be at play.
Looking ahead, US CPI data is in focus. The headline inflation rate is expected to tick lower for a third consecutive month, slipping to 1.1 percent on-year. A soft result may bolster hopes for a bit more generosity from the Fed’s open-ended QE effort, which may offer commodities a bit of a lift.
GOLD TECHNICAL ANALYSIS
Gold prices struggled to make good on a would-be technical break higher, as expected. Support in the 1747.74-65.30 area is once again in focus, with a break below that opening the door to a test below the $1700/oz figure. Alternatively, a breach of resistance in the 1860.00-70.10 zone eyes the 1911.44-28.82 region next.
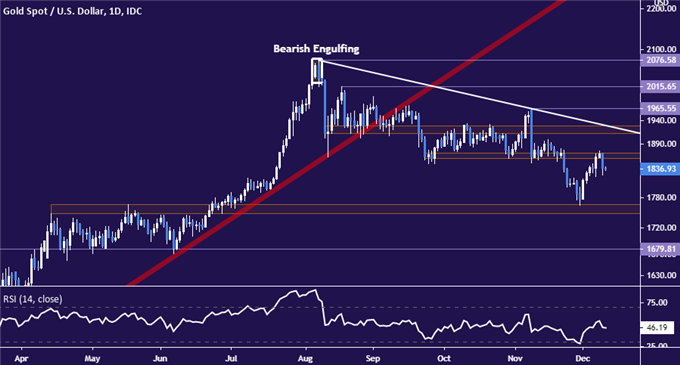
Gold price chart created using TradingView

COMMODITY TRADING RESOURCES
- What is your trading personality? Take our quiz to find out
- See our guide to build confidence in your trading strategy
- Join a free live webinar and have your questions answered
--- Written by Ilya Spivak, Head APAC Strategist for DailyFX
To contact Ilya, use the comments section below or @IlyaSpivak on Twitter


