


Gold, XAU/USD, Crude Oil, Stopgap Bill, Fed, Treasury, Technical Analysis - Talking Points:
- Gold prices reversed losses as yields fell on Treasury-Fed squabble
- Crude oil may be at risk on rising US Covid cases, lockdown threats
- XAU/USD holds at key support, WTI on the cusp of key resistance
It could have been a worse day for gold prices. The yellow metal was initially off to a poor start on Thursday. XAU/USD then reversed course as the US Dollar and Treasury yields weakened towards the latter half of the Wall Street trading session. Growth-linked crude oil prices were little changed, adhering to persistent sideways price action since June.
Financial markets appeared to initially welcome progress between policymakers in Congress over a $1.4 trillion spending bill to avert a government shutdown later in December. However, a spat between the Treasury and Federal Reserve then deteriorated sentiment. Treasury Secretary Steven Mnuchin asked the Fed to return unused stimulus funds back to the department in order to redirect them.
This comes as the nation remains on hold for another fiscal package with lawmakers likely in gridlock until early next year. The Fed responded rather swiftly, issuing a statement that all emergency facilities should continue. These have been key to keeping credit markets lubricated, with the central bank filling the role of a backstop throughout the Covid-induced recession.
Withdrawing these programs too early could be a risk, especially with Covid cases and hospitalizations hitting records in the nation. This and the risk of lockdowns may keep market mood downbeat into the remaining 24 hours of the week. Dow Jones and S&P 500 futures are pointing lower, with gains seen in the tech-heavy Nasdaq 100. This places crude oil at risk. Gold may however find some relief from falling bond yields.

Gold Technical Analysis
Gold prices remain idle above the critical 1848 – 1863 support zone. This range has been holding since August, preventing an extension of July’s top. Positive RSI divergence remains, showing that downside momentum is fading. That may precede a turn higher, but the 50-day Simple Moving Average could keep prices at bay. A drop through support exposes former resistance at 1818 which may act as support.

XAU/USD Daily Chart
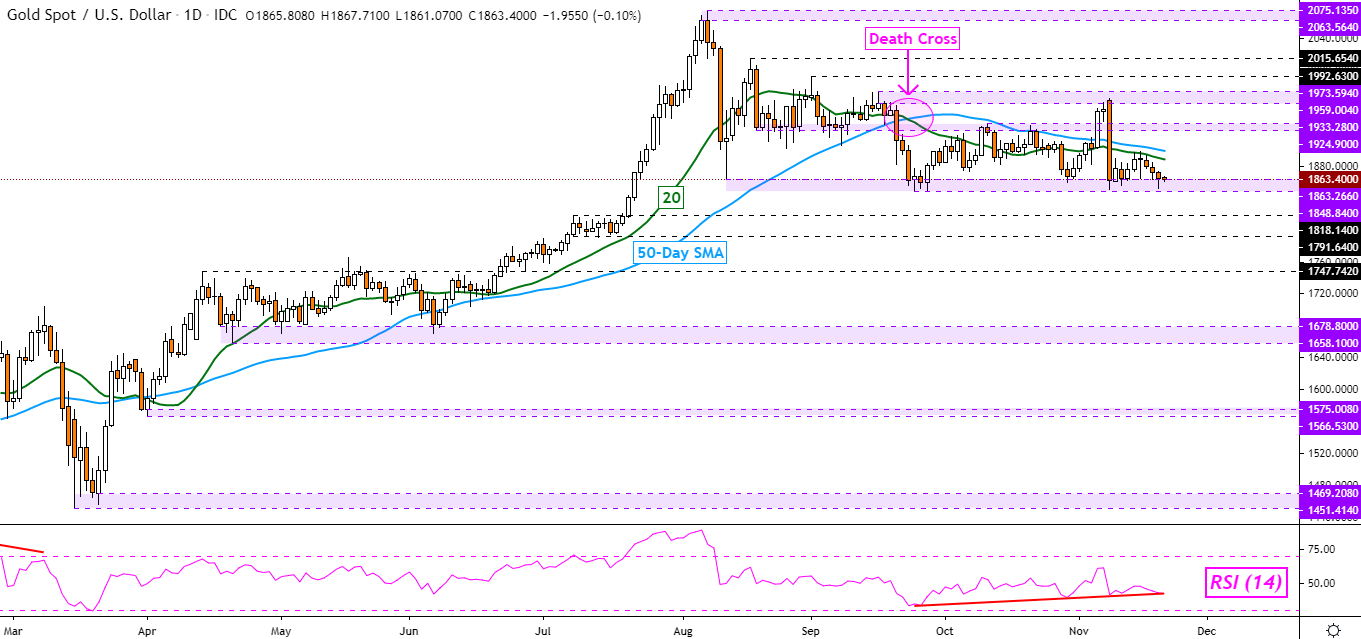
Chart Created Using TradingView
Crude Oil Technical Analysis
WTI crude oil prices are sitting on the cusp of the 41.60 – 43.75 resistance zone. This follows a bounce off the 36.15 – 37.10 support range in late October. The 50-day SMA seems to be keeping prices focused to the upside. A breakout through the ceiling exposes the 49.42 inflection point.

WTI Crude Oil Daily Chart

Chart Created Using TradingView
--- Written by Daniel Dubrovsky, Currency Analyst for DailyFX.com
To contact Daniel, use the comments section below or @ddubrovskyFX on Twitter


