


CRUDE OIL & GOLD TALKING POINTS:
- Crude oil prices may not find lasting help in EIA inventory data
- Weak demand underpinning oversupply despite production drop
- Gold prices might be pressured by comments from Fed officials
Crude oil prices seemed unimpressed by Augusts’ upbeat ISM manufacturing data. It showed that US factory-sector activity growth unexpectedly accelerated to the fastest in almost two years. The WTI benchmark briefly rose but the move soon fizzled, with prices then slumping back toward the floor of their one-week range. API data showing US inventories shed 6.36 million barrels last week also passed without fireworks.
The spotlight now turns to official EIA inventory numbers. Baseline forecasts see a drop of 2.14 million barrels. A supportive surprise may be in store if the lead from API is followed, but that may not be enough for a lasting push upward. While stockpiles have drained somewhat since peaking in mid-June as Covid-19 lockdowns saw production plunge, they remain sharply higher than average amid weak demand.
GOLD PRICES MAY FALL AS FED OFFICIALS SIGNAL WAIT-AND-SEE STANCE
Gold prices were more responsive to the ISM result, retreating from intraday highs to finish the day little-changed while the US Dollar mounted a rebound. The outcome seemed to bolster the sense that the Federal Reserve will hold back from expanding its stimulus toolkit for the time being. Comments from Fed Governor Lael Brainard later in the day appeared to reinforce as much.
Another busy offering on the Fed-speak calendar probably has the most market-moving potential in the day ahead. Comments from New York Fed President John Williams – a thought leader on the policy-setting FOMC committee – as well as his Cleveland and San Francisco colleagues Loretta Mester and Mary Daly are due. Gold may face selling pressure if they reiterate the Fed’s apparent transition to wait-and-see mode.

CRUDE OIL TECHNICAL ANALYSIS
Crude oil prices remain pinned to resistance in the 42.40-43.88 area, though the outlines of a Rising Wedge chart formation hint a downturn may be brewing ahead. A daily close below the pattern’s floor eyes minor support in the 37.10-38.56 zone, followed by the 34.38-78 inflection region. Alternatively, a push above resistance seems likely to allow for a challenge of the $50/bbl figure.
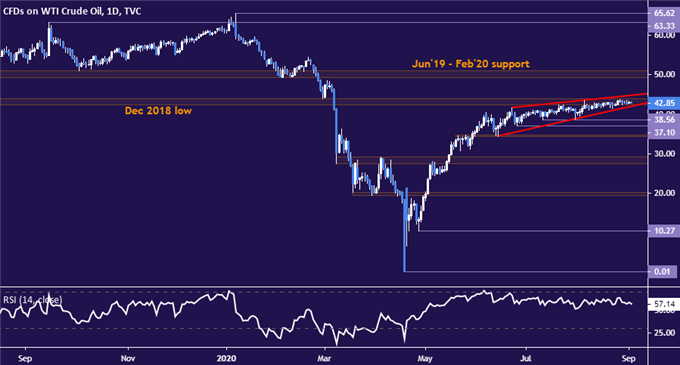
Crude oil price chart created using TradingView
GOLD TECHNICAL ANALYSIS
Gold prices are idling at support guiding the uptrend from mid-March. Breaking above swing-top resistance at 2015.65 likely exposes the record high at 2076.58. Alternatively, a turn below the $1900/oz figure that clear both range and trend line support may mark the start of a lasting reversal, with downside barriers clustered around the $1800/oz mark in focus next.
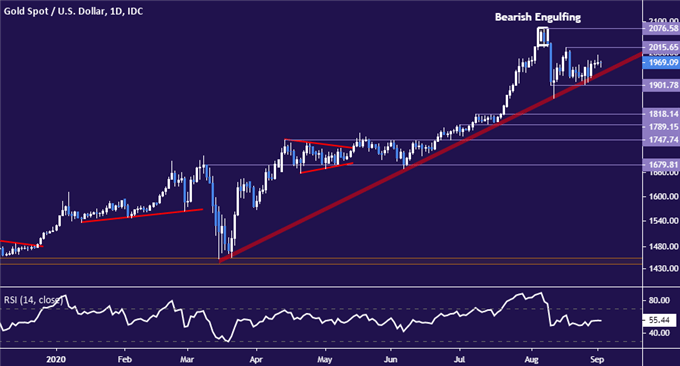
Gold price chart created using TradingView

COMMODITY TRADING RESOURCES
- See our free guide on the drivers of crude oil price trends
- What is your trading personality? Take our quiz to find out
- Join a free live webinar and have your questions answered
--- Written by Ilya Spivak, Head APAC Strategist for DailyFX
To contact Ilya, use the comments section below or @IlyaSpivak on Twitter


