


CRUDE OIL & GOLD TALKING POINTS:
- Crude oil prices hold up as US inventories drain amid output slump
- Easing OPEC+ production curbs, dismal demand outlook overlooked
- Gold prices eye FOMC minutes, US fiscal stimulus talks for direction
Crude oil prices may find a near-term lift as risk appetite firms across global financial markets. Shares rose in Asia-Pacific trade despite the sudden breakdown of US-China trade talks late Friday. Bellwether S&P 500 futures now point higher, hinting the upbeat tone has scope for follow-through.
Establishing momentum for more lasting gains may be more challenging however. Broadly speaking, the WTI benchmark has been anchored in a narrow range since early June. That is despite the unwinding of an output cut scheme by the OPEC+ group of top producers lead by Saudi Arabia and Russia.
Interestingly, prices have managed to hold up even though this amounts to an increase in global output. Markets have also taken in stride darkening demand prospects against the backdrop of the sharp contraction in economic activity thanks to the Covid-19 pandemic.
CRUDE OIL PRICES SUPPORTED AS US INVENTORIES DRAIN AMID OUTPUT SLUMP
Some of that resilience probably owes to a gradual drawdown from bloated inventories over the past two months. Stockpiles surged to a three-year high as the pandemic crushed demand, but this was soon followed by crumbling production levels. US daily output is now hovering at a two-year low.
Looking ahead, the EIA Drilling Productivity report is in focus. Baker Hughes data tracking the number of active US oil rigs foreshadows that US extraction is continuing to slow. That might set the stage for inventories to deflate further, implying support for prices can endure for now.
GOLD PRICES EYE FOMC MINUTES, FISCAL STIMULUS TALKS FOR DIRECTION
Gold prices may struggle for direction in the meanwhile. The metal has been licking its wounds in a narrow trading band since plunging amid ebbing prospects for near-term Fed stimulus expansion. Wednesday’s release of minutes from July’s FOMC meeting may mark the next inflection point in the narrative.
In the interim, the fate of a second US fiscal stimulus effort may be trend-shaping. If Democrats and Republicans manage to bridge their differences and agree on a package of $2 trillion or larger, this might be seen as sharing enough of the Fed’s burden to reduce scope for monetary expansion further.

CRUDE OIL TECHNICAL ANALYSIS
Crude oil prices continue to mark time below resistance in the 42.40-43.88 area. Breaching this barrier with confirmation on a daily closing basis looks likely to expose the $50/bbl figure. Alternatively, a turn back below initial support at 38.74 might see the next noteworthy support in the 34.38-78 inflection zone.
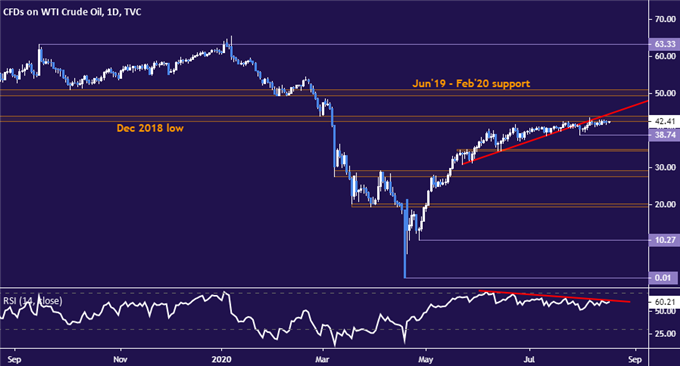
Crude oil price chart created using TradingView
GOLD TECHNICAL ANALYSIS
Gold prices are digesting losses having dropped after forming a Bearish Engulfing candlestick pattern, as expected. The plunge has stalled at trend line support defining the 2020 advance. A break below this barrier on a daily closing basis initially targets an inflection area clustered around the $1800/oz figure.
Alternatively, a turn up and through resistance at 1955.90 may set the stage for another challenge of the $2000/oz handle. Securing a foothold back above that may pave the way for another attempt to conquer swing top resistance at 2076.58.
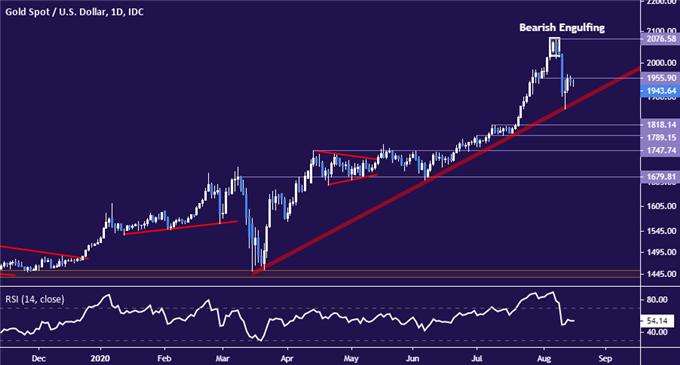
Gold price chart created using TradingView

COMMODITY TRADING RESOURCES
- See our free guide on the drivers of crude oil price trends
- What is your trading personality? Take our quiz to find out
- Join a free live webinar and have your questions answered
--- Written by Ilya Spivak, Head APAC Strategist for DailyFX
To contact Ilya, use the comments section below or @IlyaSpivak on Twitter


