


GOLD & CRUDE OIL TALKING POINTS:
- Gold prices up with stocks while the US Dollar drops in risk-on trade
- Crude oil prices lifted by sentiment but struggling at chart resistance
- US fiscal stimulus boost and tensions with China, Q2 earnings eyed
Gold prices continued to push higher, animated by another upswell in risk appetite. The metal tracked higher alongside stocks as the upbeat mood weighed on the haven US Dollar, pushing it downward and stoking demand for anti-fiat alternatives. Crude oil prices behaved in kind, rising in lockstep with the bellwether S&P 500 equities benchmark.
Investors appeared to shrug off building tensions between the US and China after Washington ordered closed the East Asian giant’s consulate in Houston, Texas. That drew statements of outrage from Beijing. Markets were focused elsewhere however, with the newswires variously citing speculation about more US fiscal stimulus, hopes for a Covid-19 vaccine and better-than-expected earnings reports as catalysts.
Looking ahead, sentiment trends seem likely to remain at the forefront. Soundbites from Washington DC – covering both relations with China and fiscal support expansion – as well as the ongoing flow of second-quarter earnings reports may take top billing. Results from key firms including Southwest Airlines, Kimberly-Clark, AT&T, Twitter, American Airlines and Intel are on tap.
US stock index futures are pointing higher, suggesting the risk-on tilt is likely to remain in force. That bodes well for gold and crude oil prices. Nevertheless, traders remain highly sensitive to headline flow, making for the elevated probability of sudden reversals and warning against extrapolating follow-through too readily. Still, the markets have proven to be impressively resilient despite a raft of would-be headwinds.

GOLD TECHNICAL ANALYSIS
Gold prices look set to challenge resistance at 1920.94, the record high set in 2011. This barrier is reinforced by the 78.6% Fibonacci expansionat 1917.59. A daily close above the former level may expose the 100% Fib at 1984.77 next. Alternatively, a move back below the 61.8% mark at 1864.86 looks likely to be followed by a challenge of support at 1827.82, the intersection of the 50% expansion and a rising trend line.
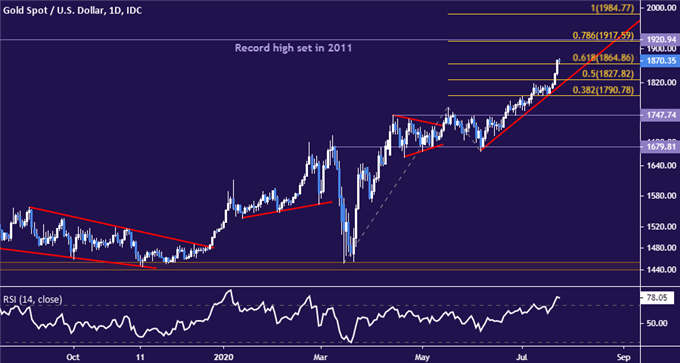
Gold price chart created using TradingView
CRUDE OIL TECHNICAL ANALYSIS
Crude oil prices continue to struggle at resistance in the 42.40-43.88 area, with negative RSI divergence warning that ebbing upside momentum may evolve into a reversal downward. A daily close below rising trend line support appears likely to expose 34.78 next. Alternatively, establishing a foothold above resistance may set the stage for a challenge of the $50/bbl figure.
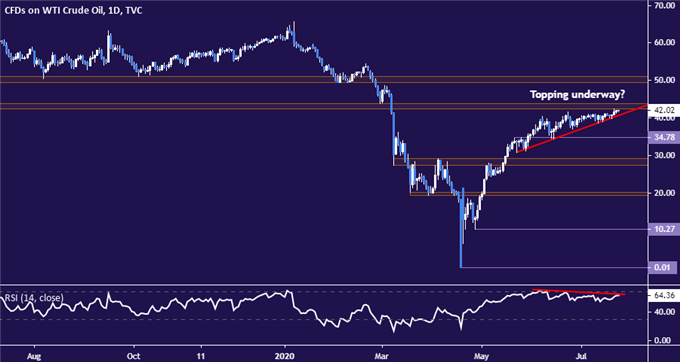
Crude oil price chart created using TradingView

COMMODITY TRADING RESOURCES
- See our free guide on the drivers of crude oil price trends
- What is your trading personality? Take our quiz to find out
- Join a free live webinar and have your questions answered
--- Written by Ilya Spivak, Head APAC Strategist for DailyFX
To contact Ilya, use the comments section below or @IlyaSpivak on Twitter


