


GOLD & CRUDE OIL TALKING POINTS:
- Gold prices still pinned in a narrow range as US Dollar, bond yields diverge
- Crude oil prices shrug off OPEC+ disappointment on US inventories plunge
- Commodities vulnerable in risk-off trade, ECB might leave markets wanting
Gold prices continue to struggle for direction. Another attempt at recovery at the beginning of the week struggling for follow-through as the divergence between the US Dollar and Treasury bond yields makes for conflicting influences.
Borrowing costs edged down a bit as risk appetite cooled, which might normally have bolstered the relative appeal of non-interest-bearing bullion were it not for a parallel rise in the US Dollar. Safety-seeking flows lifted the haven currency, undermining demand for anti-fiat assets.
Crude oil prices managed to finish Wednesday’s session on a high note as EIA inventory data showed US stockpiles shed 7.49 million barrels to mark the largest weekly draw this year. Prices were pressured earlier as OPEC+ confirmed it would begin to phase out its output cut scheme next month.
GOLD, CRUDE OIL MAY FALL AS RISK APPETITE SOURS ACROSS MARKETS
Looking ahead, a defensive tone is emerging. Bellwether S&P 500 futures are pointing conspicuously lower, signaling a risk-off tilt. That seems to suggest that parallel losses for crude oil and gold prices already recorded in Asia-Pacific trade have scope for follow-through.
The incoming ECB monetary policy announcement seems likely to find the central bank in wait-and-see mode. Financial conditions have markedly improved amid a wave of global stimulus since March, the pace of economic contraction has slowed considerably, and overall data flow has improved.
Interestingly, that may contribute to investors’ downbeat mood. The markets continue to pine for evermore policy support and may be displeased to find the ECB unwilling to top up existing efforts despite a generally dour assessment of the overall backdrop.

GOLD TECHNICAL ANALYSIS
Gold prices are treading water abovethe 38.2% expansion at 1789.78. A daily close below this barrier would double as a break of the near-term uptrend and is likely to set the stage for a pullback to 1747.74. Alternatively, a break above resistance at 1827.82, the 50%Fib, seems to expose the 61.8% mark at 1864.86 next.
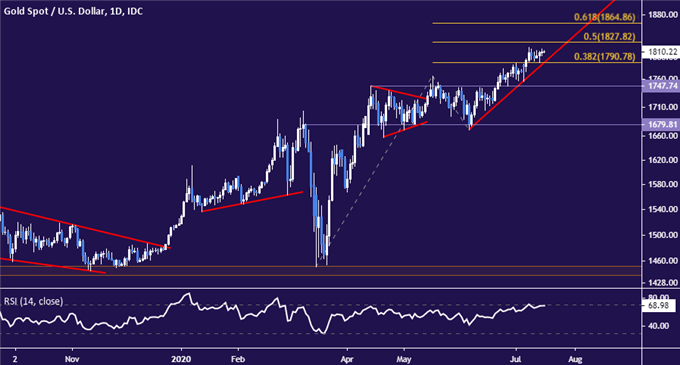
Gold price chart created using TradingView
CRUDE OIL TECHNICAL ANALYSIS
Crude oil prices remain stuck between rising trend line support set from late May and resistance in the 42.40-43.88 zone. A breakdown confirmed on a daily closing basis looks likely to expose 34.78 next. Alternatively, a push through resistance probably sets the stage for a challenge of the $50/bbl figure.
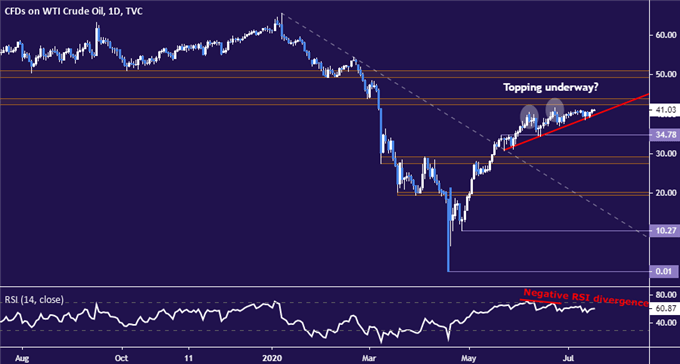
Crude oil price chart created using TradingView

COMMODITY TRADING RESOURCES
- See our free guide on the drivers of crude oil price trends
- What is your trading personality? Take our quiz to find out
- Join a free live webinar and have your questions answered
--- Written by Ilya Spivak, Head APAC Strategist for DailyFX
To contact Ilya, use the comments section below or @IlyaSpivak on Twitter


