Gold, XAU/USD, Crude Oil, Canada GDP - Talking Points:
- Gold prices may be at risk to turning lower ahead
- Crude oil prices saw the best day in over 3 weeks
- Canada GDP may boost sentiment in coming hours
Anti-fiat gold prices spent the previous 24 hours in range-bound trade which was also seen in the US Dollar and in longer-dated Treasury yields. The latter two are key fundamental drivers for XAU/USD. Financial markets spent Monday recovering from the risk aversion tone left behind at the end of last week. The S&P 500 and Dow Jones closed +1.47% and +2.32% respectively.


The improvement in risk appetite supported growth-oriented crude oil prices as WTI experienced its best day in over 3 weeks (+3.8%). A combination of rosy US home sales and Boeing being given the greenlight to begin testing its troubled 737 MAX plane likely improved market mood. This is as US coronavirus cases only climbed 1.2% over the past 24 hours, lower than the previous week’s 1.6% average.
Crude oil prices may continue climbing as S&P 500 futures point higher following better-than-expected Chinese manufacturing PMI data. The latter may have supported global growth recovery bets, which could be underscored by upcoming Canadian GDP data. For gold prices, the near-term trajectory is more uncertain. Rising optimism in financial markets may boost government bond yields at the expense of USD.
Discover your trading personality to help find optimal forms of analyzing financial markets
Gold Technical Analysis
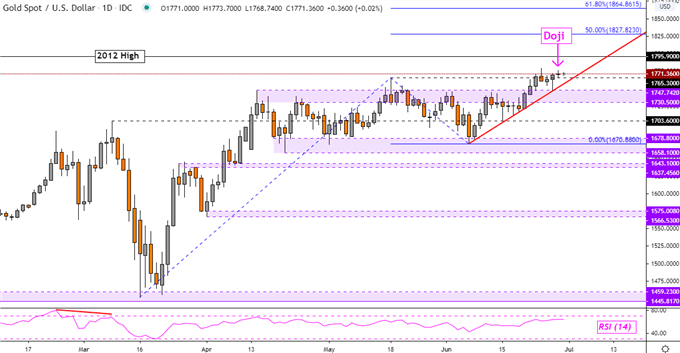
Gold prices have left behind a Doji candlestick on the daily chart. This is a sign of indecision which could precede a turn lower given a close lower ahead. That would place the focus on near term rising support from the beginning of June – red line. Otherwise, further gains may see the precious metal continue on its cautious journey towards the 2012 high at 1795.
| Change in | Longs | Shorts | OI |
| Daily | -1% | 7% | 3% |
| Weekly | 8% | -14% | -4% |
XAU/USD Daily Chart

Chart Created Using TradingView
Crude Oil Technical Analysis
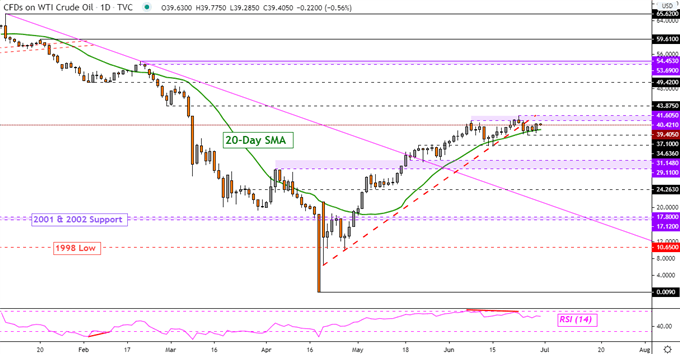
WTI crude oil prices remain under key resistance at 40.42 – 41.60. Immediately below, the 20-day simple moving average (SMA) sits as support. Resuming the uptrend entails pushing above the former, opening the door to testing 43.87, the January low. Otherwise, a descent through the 20-day SMA opens the door to testing 39.40. Taking out the latter exposes 37.10.
| Change in | Longs | Shorts | OI |
| Daily | 2% | -1% | 1% |
| Weekly | 24% | -23% | 4% |
WTI Crude Oil Daily Chart

Chart Created Using TradingView
--- Written by Daniel Dubrovsky, Currency Analyst for DailyFX.com
To contact Daniel, use the comments section below or @ddubrovskyFX on Twitter


