


Gold, XAU/USD, Crude Oil - Talking Points:
- XAU/USD rallies as US Dollar selloff resumed course
- Crude oil prices faltered on Saudi Arabia output news
- Gold prices still ranging, WTI may be at risk to falling
Anti-fiat Gold prices rallied over the past 24 hours as the haven-oriented US Dollar extended its sharp selloff from late May. The Dow Jones and S&P 500 closed +1.70% and +1.20% respectively as the latter erased losses from the turn of the year to aim for current 2020 peaks. An expansion in the Federal Reserve’s Main Street Lending Program helped boost equities into Wall Street’s close.

Growth-oriented crude oil prices were unable to capitalize on the upbeat tone in financial markets. This is likely due to Saudi Arabia announcing that the voluntary additional production cuts – agreed upon from the weekend OPEC+ meeting – would go on for just 1 month. That could mean that the world could see insufficient reductions in supply to counterbalance weak demand due to global growth slowing.
Over the next 24 hours, the economic docket is fairly light as investors await this week’s Federal Reserve monetary policy announcement. Final revisions to Eurozone GDP for the first quarter are due ahead, but gold and crude oil prices may continue focusing on general market sentiment. Futures tracking the S&P 500 are little changed heading into European trading hours.
Gold Technical Analysis
Gold prices have closed under a near-term rising support line from the middle of April – red line on the daily chart below. That may open the door to a reversal given confirmation. On the whole however, XAU/USD remains in a consolidating setting. Prices are hovering just above the key support range (1658 – 1678). A bounce here would open the door to test resistance which is a barrier between 1730 – 1747.
| Change in | Longs | Shorts | OI |
| Daily | 4% | -3% | 0% |
| Weekly | 9% | -8% | 1% |
XAU/USD Daily Chart
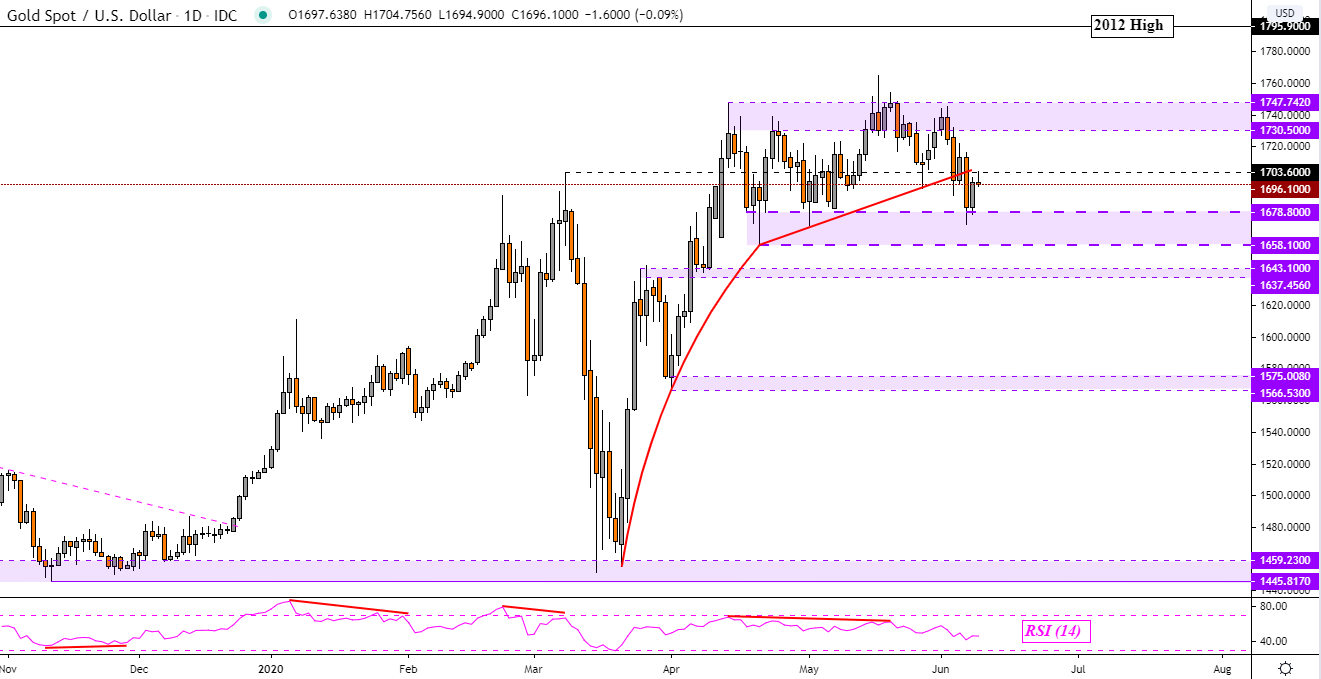
Chart Created Using TradingView
Crude Oil Technical Analysis
Crude oil prices could be at risk to turning lower. A Bearish Harami has emerged within a Rising Wedge chart pattern. Both of these could be signals that the current WTI price trend could reverse lower. This is as prices struggle to push above the August 2016 low which is acting as resistance at 39.23. A turn lower here places the focus on the inflection range between 29.11 – 31.14.
| Change in | Longs | Shorts | OI |
| Daily | 3% | -5% | 0% |
| Weekly | -13% | 14% | -6% |
WTI Crude Oil Daily Chart
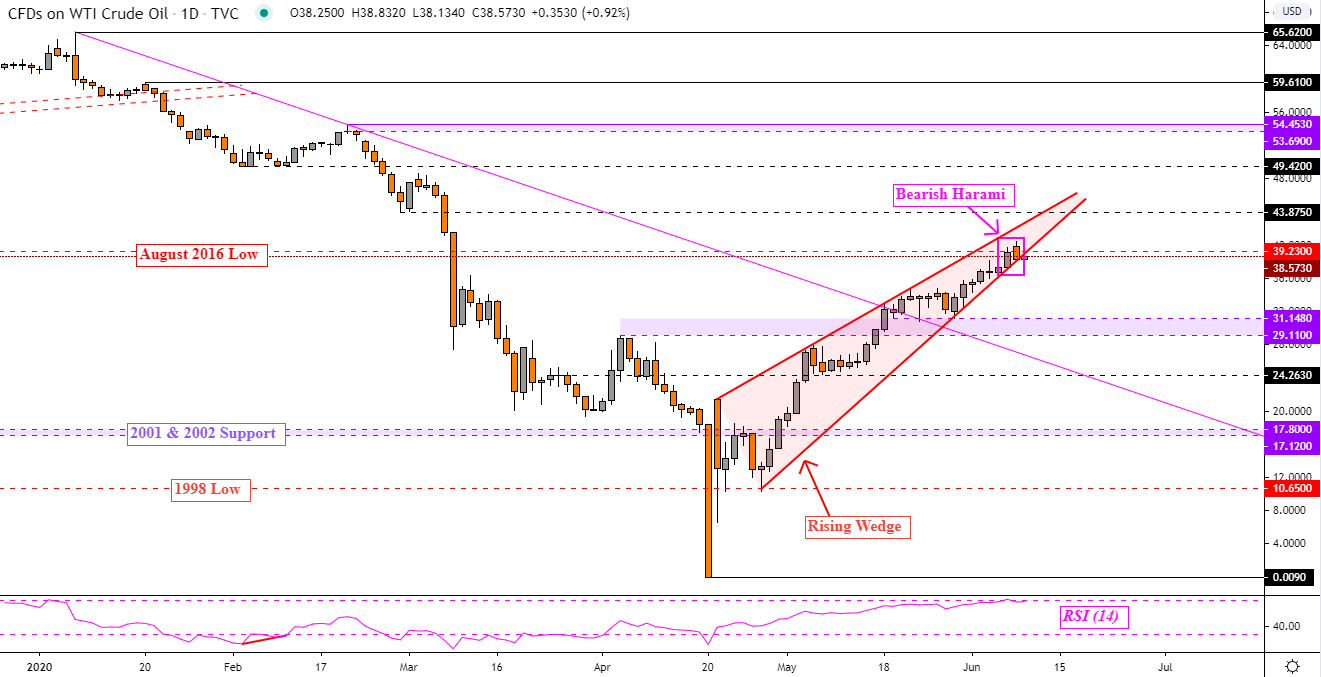
Chart Created Using TradingView
--- Written by Daniel Dubrovsky, Currency Analyst for DailyFX.com
To contact Daniel, use the comments section below or @ddubrovskyFX on Twitter


