


CRUDE OIL & GOLD TALKING POINTS:
- Crude oil prices up with stocks after Trump statement on Hong Kong
- Markets seemed to be expecting a harsher response against Beijing
- Gold price rise may reflect bets on more Fed stimulus amid US unrest
Crude oil prices edged higher at the weekly trading open, echoing a broadly optimistic tone in Asia-Pacific trade. Regional bourses added more than 2 percent on average in a move that seemed to be animated by US President Donald Trump, who shied away from announcing harsh steps to punish China for a new security law that Washington says compromises Hong Kong’s autonomy.
Speaking at a closely-watched press conference on Friday, Trump said that he will not abandon the Phase-1 US-China trade deal struck late last year. Instead, he threatened to ‘begin the process’ of revoking Hong Kong’s preferential economic treatment and sanction individual officials. The President added that a working group will study US-listed Chinese companies, with as-yet unclear intent.
Subsequent price action suggests that markets feared much worse, particularly since Mr Trump has previously said that additional tariffs are the best counter-measure for what he sees as China’s many misdeeds (in that particular instance he was apparently talking about Beijing’s handling of the Covid-19 outbreak). Bellwether S&P 500 index futures are pointing higher to suggest the risk-on mood.
Interestingly, gold prices are on the upswing against this backdrop. In fact, the metal has been rising since the middle of last week, seemingly oblivious to the broader macro narrative. That may reflect swelling unrest in the US. The metal’s rise – and a parallel US Dollar selloff – may reflect bets on Fed stimulus to offset the economic hit from increasingly disruptive and violent nationwide protests following the killing of George Floyd by a police officer in Minneapolis, Minnesota.

CRUDE OIL TECHNICAL ANALYSIS
Crude oil prices edged past range resistance at 34.78, seemingly opening the door for a retest of former support in the 42.40-43.88 area. A daily close above that looks likely to set the stage for a challenge of the $50/bbl figure. However, negative RSI divergence warns of ebbing upside momentum and hints that a reversal lower may be in the cards. Slipping back below 34.78 – now recast as support – appears to initially target the 27.40-29.11 inflection zone.
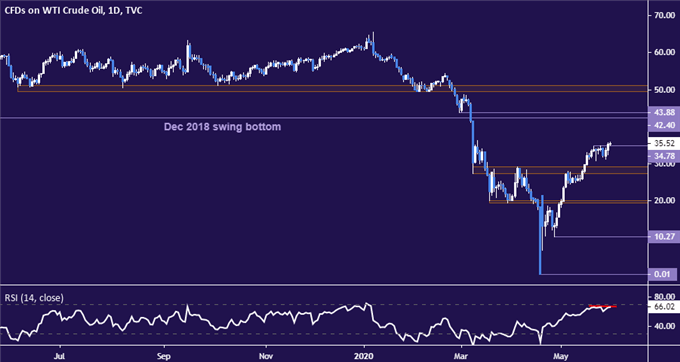
Crude oil price chart created using TradingView
GOLD TECHNICAL ANALYSIS
Gold prices found support below the $1700/oz figure and rebounded, eyeing the swing top at 1765.30 once again. A daily close below that and the 23.6% Fibonacci expansion at 1768.00 probably sets the stage for a test of the 38.2% level at 1813.83 next. Alternatively, a reversal below the 1679.81-93.92 support zone puts the 38.2% Fib retracement into focus.
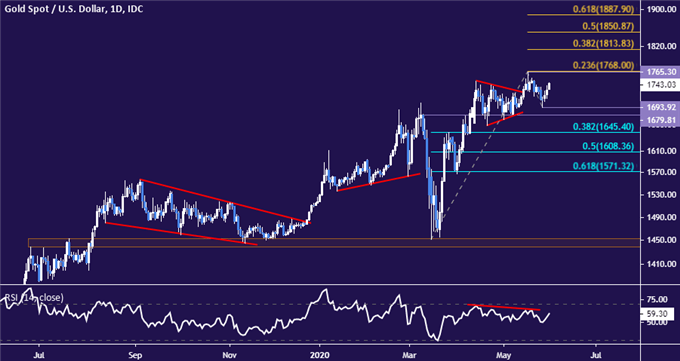
Gold price chart created using TradingView

COMMODITY TRADING RESOURCES
- See our free guide on the drivers of crude oil price trends
- What is your trading personality? Take our quiz to find out
- Join a free live webinar and have your questions answered
--- Written by Ilya Spivak, Head APAC Strategist for DailyFX
To contact Ilya, use the comments section below or @IlyaSpivak on Twitter


