


Crude Oil and Gold Talking Points:
- US crude oil prices rose again
- Hopes for economic re-emergence helped as did the Federal Reserve Chair’s quiet optimism
- Gold prices gained too, however, as Japan entered recession
Crude oil prices added about a Dollar per barrel on Monday in Asia, rising to their highest levels for a month on hopes that the gradual re-opening of economies shuttered by coronavirus, and production cuts already made, will be enough to support energy markets.
Federal Reserve Chair Jerome Powell’s weekend commentary may also have helped. He was keen to point out that in his view the Fed still has plenty of stimulative monetary options and is not, out of ammunition. He also seems to have revived risk appetite more broadly with his assertion that the world’s economic travails do not foreshadow some twenty-first-century re-run of the Great Depression.
| Change in | Longs | Shorts | OI |
| Daily | 2% | -10% | -2% |
| Weekly | 28% | -33% | 3% |
In addition to official production cuts now in place from Organization of Petroleum Exporting Countries and allies including Russia, output is falling elsewhere with the number of oil rigs operating in the US falling to a new record low last week. The benchmark US June futures contract is due to expire this week and it has not slid into negative territory as the May one did so memorably.
| Change in | Longs | Shorts | OI |
| Daily | 3% | -5% | -1% |
| Weekly | 12% | 3% | 7% |
Official growth data showed the fully-expected news that Japan fell into recession in the first three month’s of this year, chalking up a second telltale consecutive quarter of falling growth. Monetary and fiscal authorities around the world seem convinced that recovery will come quite shortly and that this year’s first half will represent the clear peak of Covid’s baleful impact. Markets seem to be keeping faith with this.
Gold prices were also higher, rising to peaks not seen since October 2012.
Beyond the contagion’s uncertain long-term affects the gold market is also seeing support from apparently deteriorating relations between Washington and Beijing, and also from the re-emergence of some pre-Corvid markets worries such as the possibility of a no-deal Brexit as talks between the European Union and United Kingdom seem deadlocked.
The week is likely to bring more gloomy economic news in the shape of Purchasing Managers Index data from the US, UK, Japan and the Eurozone.
Crude Oil Technical Analysis
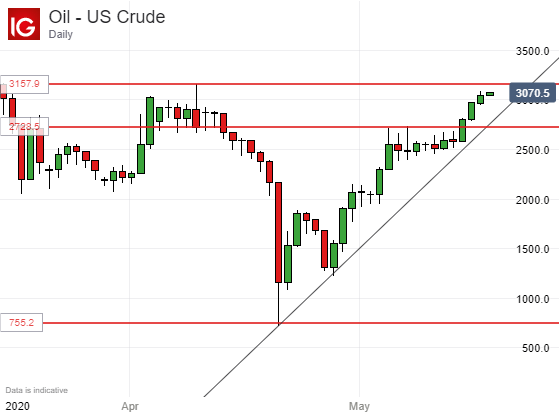
US crude oil prices have risen sharply from their April lows, with the steep uptrend established then still very much in place. After a modest pause prices are back in a trading zone which last held sway between April 3 and 13. Its lower boundary at $27.29 looks safe enough but bulls have not so far managed to pass its top, derived from April 8’s intraday peak of $31.58. As long as this range holds even a break below that uptrend line need not be very bearish for this market. It currently offers support quite close to current levels, at $28.17.
Gold Technical Analysis
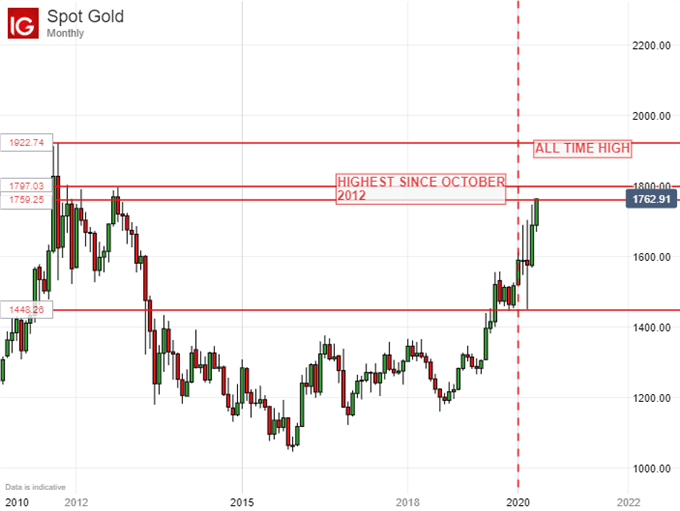
The gold market looks set to make May another very bullish month after the big gains already seen in April.
It’s now edging back into a price range last seen between September 2011 and October 2012, which bars the way to the all-time highs seen in August 2011. The market will need to consolidate there, between $1759.25 and $1797.03 before attempting to re-take those. The fate of this range at month-end could be instructive.
Commodity Trading Resources
- See our guide to learn about the long-term forces driving crude oil prices
- Having trouble with your strategy? Here’s the #1 mistake that traders make
- Join a free webinar and have your commodity market questions answered
--- Written by David Cottle, DailyFX Research
Follow David on Twitter @DavidCottleFX or use the Comments section below to get in touch!


