


Gold and Crude Oil Talking Points:
- Gold prices pared early gains but the market remains well supported
- Australian job losses soared last month, according to official figures
- Crude oil markets were surprised by a surprise stock drawdown in the US
Gold prices rose initially in Thursday’s Asia Pacific session as worries about the coronvirus’ longer-term effects on the US economy drove investors into haven assets. However, they wilted later having run into sellers at the $1720/ounce level.
Federal Reserve Chairman Jerome Powell warned of a ‘significantly worse’ recession than any seen since World War Two. He suggested that negative interest rates would not be seen soon but reassured listeners that the Fed would use its abilities as needed, while calling for more fiscal spending to juice the economy.
The prospect of global loose monetary policy is Unsurprisingly supportive for gold. The non-yielding metal tends to do well when bond yields are low, and also when governments switch on the money-printing presses. Both circumstances seem likely to remain with us for months if not years now.
Australia provided market participants with a grim object lesson in Corvid economics. Official data revealed that April saw just under 600,000 job losses, with more very likely on the way. This doesn’t look like an environment in which gold will see sustained selling.
| Change in | Longs | Shorts | OI |
| Daily | -3% | 8% | 3% |
| Weekly | 8% | -10% | -2% |
Crude oil prices rose quite strongly into the start of Thursday’s trading, but they returned some of those gains as the session progressed.
A surprise fall in US stockpiles was recorded in the week to May 8 by the Energy Information Administration. Crude inventory fell by 745,000 barrels when analysts had looked for an increase of 4.1 million. However, overall stocks remain high at 531.5 million barrels and concerns about the hit still to be inflicted on global energy demand by the contagion are capping the market.
Gold Prices Technical Analysis
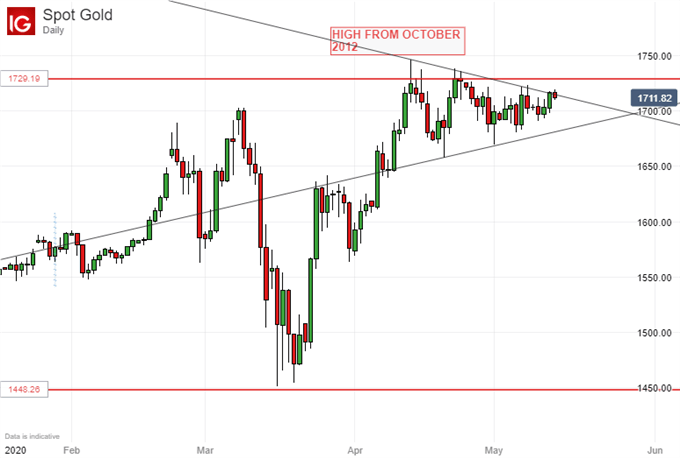
Gold prices are testing the downtrend line in place since April 14. It’s now right where the market is at $1714/ounce. A durable break above that point could see the end of the converging pennant pattern of up and downtrends clearly visible on the chart, and confirm the continuation of the upward move which preceded its formation.
However, it’s too soon yet to be sure that that is what we’re seeing, with the week’s close likely a better guide to sentiment. Support around the psychological $1700 region looks quite solid to the downside.
Crude Oil Prices Technical Analysis
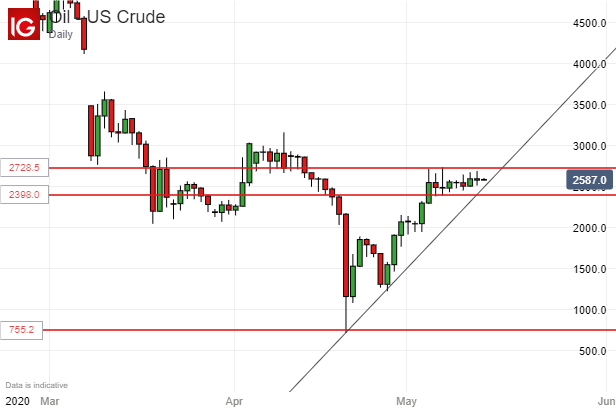
US crude oil prices remain trapped in a narrow range with their uptrend from April’s lows about to face an imminent test. A move below it need not necessarily presage further falls, but an extension of current range trade will see the uptrend broken, possibly as soon as this session. The market looks increasingly indecisive, as narrow daily ranges suggest, but a durable range break either way is likely to be more instructive now than a move through that trend line.
| Change in | Longs | Shorts | OI |
| Daily | -6% | 4% | -3% |
| Weekly | 15% | -25% | 0% |
Commodity Trading Resources
- See our guide to learn about the long-term forces driving crude oil prices
- Having trouble with your strategy? Here’s the #1 mistake that traders make
- Join a free webinar and have your commodity market questions answered
--- Written by David Cottle, DailyFX Research
Follow David on Twitter @DavidCottleFX or use the Comments section below to get in touch!


