


GOLD & CRUDE OIL TALKING POINTS:
- Gold prices unable to sustain rise to 7-year high amid market rout
- Stabilizing Fed rate cut expectations may explain gold’s reticence
- Crude oil prices on pace for worst 1-day performance since 1991
Gold prices spiked higher but ultimately struggled to capitalize amid dramatic liquidation across financial markets at the start of the global trading week. The metal touched a seven-year high above the $1700/oz figure as downbeat Chinese economic data and the apparent collapse of the OPEC+ crude oil output cap scheme sent investors into panic mode. That pushed bonds higher and pulled down yields, boosting the relative appeal of non-interest-bearing alternatives.
The move higher would prove short-lived however, with prices pulling back as the priced-in rate cut outlook implied in Fed Funds futures stabilized alongside the yield spread between 2-year US Treasury notes and an average of equivalents from Germany, Japan, the UK and Australia. This hints that asset values may already reflect as much easing as the US central bank can be reasonably expected to deliver, as least for now.
As it stands, that implies a further 75-100bps in cuts on top of the surprise 50bps reduction triggered last week. The probability that at least 50bps of the adjustment will occur later this month stands at a commanding 100 percent. Even so, the US still enjoys an average front-end yield advantage of 0.48 percent against major alternatives. That probably makes the US Dollar a more attractive haven than non-yielding gold.
GOLD PRICE CHART WARNS UPSIDE MOMENTUM MAY BE FADING
Prices are now hovering below resistance in the 1684.86-89.30 area (50% Fibonacci expansion, February 24 high, with negative RSI divergence warning that a turn lower may be brewing. A daily close back below the 38.2% level at 1656.13 may expose the 1611.34-20.58 zone (January 8 high, 23.6% Fib). A breakout upward sees the 61.8% expansion at 1713.59 as the next level of note.

Gold price chart created using TradingView

CRUDE OIL PRICES ON PACE FOR BIGGEST DAILY DROP IN 29 YEARS
The response from crude oil prices to the day’s dramatic news-flow was decidedly more straight-forward. The WTI benchmark swooned, gapping lower at the weekly trading open to revisit levels unseen in four years. It is now on pace to shed nearly 30 percent, amounting to the worst one-day performance since January 1991. A daily close below 31.11 (78.6% expansion) may expose the 0.26.05-33 zone (4-year low, 100% Fib).
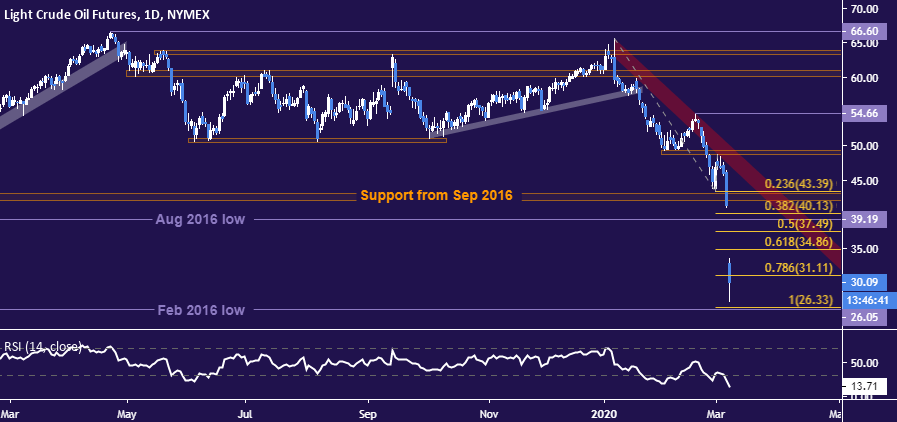
Crude oil price chart created using TradingView
COMMODITY TRADING RESOURCES
- See our guide to learn about the long-term forces driving crude oil prices
- Having trouble with your strategy? Here’s the #1 mistake that traders make
- Join a free webinar and have your commodity market questions answered
--- Written by Ilya Spivak, Currency Strategist for DailyFX.com
To contact Ilya, use the comments section below or @IlyaSpivak on Twitter


