Gold and Crude Oil Talking Points:
- Gold prices came down a little from last week’s highs
- Chinese stocks fell sharply on return from their new year break
- Crude oil edged up as markets eye possible producer action
Gold prices eased back further from last week’s four-week peaks on Monday. The coronavirus story is still driving markets, and Chinese stocks took a big hit as they returned from their extended new year break.
However other growth-correlated assets stabilized and there seems to be some hope that the disease won’t offer the sort of global economic hit associated with previous outbreaks such as 2003’s Severe Acute Respiratory Syndrome outbreak. Coronavirus seems at this stage to be far less lethal than SARS, despite its contagious nature.
The Chinese authorities have also pledged to deploy a variety of monetary tools to cushion local markets from the effects of the virus.
| Change in | Longs | Shorts | OI |
| Daily | -3% | 11% | 4% |
| Weekly | -1% | -5% | -3% |
Still, Chinese economic data showed the manufacturing sector still only just in expansion territory, with industrial profits posting their first annual fall for four years in 2019. They were down by 3.3% according to official data.
Given that this is only one of plentiful economic uncertainties only likely to be deepened by the virus’ effects, the underlying haven bid for gold seems solid enough and will probably remain so.
The next order of business for all markets is likely to be the Institute for Supply Management’s monthly snapshots of employment and manufacturing health in the US. They’re due later in Monday’s global session.
Crude Prices Rise Slightly But Remain Clearly Pressured
Crude oil prices inched back up as the Asian session went on. Fears that the virus may slow demand for crude seem to remain quite widespread but there are also various reports that the Organization of Petroleum Exporting Countries could bring its scheduled March meeting forward to this month.
Should it do so there will be inevitable suspicions that supply cuts could be deepened, lengthened or both and this may already be giving the market a measure of support. OPEC production slipped to its lowest since 2009 in January as Saudi Arabian output was cut by more than its agreed reduction and Libyan supply was halted by hostilities there.
Both US crude and the international Brent benchmark fell for a fourth straight week last week as broadening travel bans to and from China kept demand worries in focus.
Gold Technical Analysis
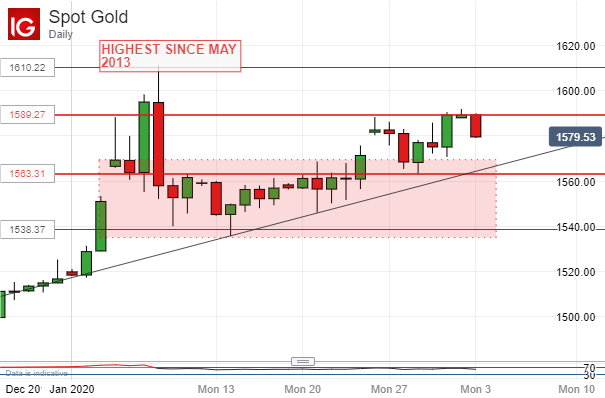
Prices remain clearly within the new, higher range built since last week above the previous short-term trading band.
While a durable break in either direction should give a powerful near-term lead, there seems very little appetite to push this market far beyond January’s highs, even though they remain very close to current levels.

Still, the market remains in a clear, gradual uptrend from the lows of mid-January which is still more than $15/ounce below current levels. Even a attest of that would require an unusually large daily fall by current standards, and it’s by no means certain that support there wouldn’t hold. Below that focus would return to the current range base at $1663.31.
Crude Oil Technical Analysis

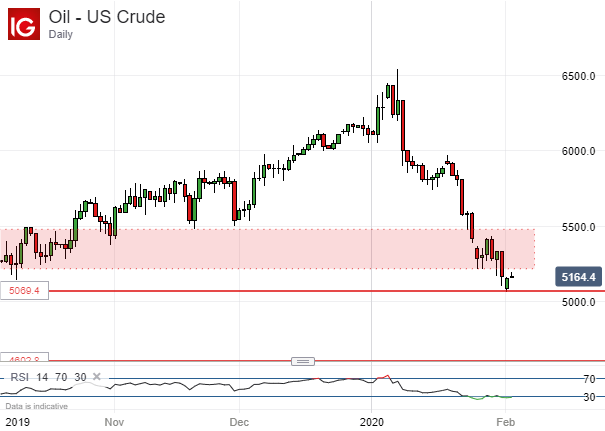
US crude oil prices have slipped below the broad range they’d been stick at for a week or so, which was also in place back in October 2019. They’ve bounced at what were essentially 2019’s lows, with the psychologically important $50/barrel level now well within range of the bears.
However, the suspicion that OPEC could be about to act, or to bring forward action, to support prices may well make the market nervous about pushing too far below that point. Fundamental headlines are likely to drive from here.
| Change in | Longs | Shorts | OI |
| Daily | -1% | 3% | 0% |
| Weekly | 13% | -25% | -1% |
Commodity Trading Resources
- See our guide to learn about the long-term forces driving crude oil prices
- Having trouble with your strategy? Here’s the #1 mistake that traders make
- Join a free webinar and have your commodity market questions answered
--- Written by David Cottle, DailyFX Research
Follow David on Twitter @DavidCottleFX or use the Comments section below to get in touch!


