


Crude Oil and Gold Talking Points:
- Crude oil prices slid gradually through the Asian session
- Chinese growth met forecasts but remains sluggish, with overall crude market balance under question in 2020
- Gold prices made gains even as risk appetite broadly held up
Crude oil prices crept lower through Asia-Pacific’s Friday with as-expected growth in largest global importer China providing the market with few new clues.
On one hand the data came in exactly as expected. Annualized fourth-quarter growth held at the 6% level seen in the third. However, that’s still a notable low, the weakest level seen since the first quarter of 1992.
Still, investors remain hopeful that improved trade relations with the US may see some acceleration into 2010. The latest trade numbers out of China were extremely strong, even before the effects of an interim trade deal could have been felt, but the country’s debt levels will remain cause for concern unless growth picks up very markedly.
Still, as far as the oil market is concerned, China remains extremely fertile ground. Government numbers showed that its refineries processed crude equal to a record 13 million barrels per day in 2019, up 7.6% from 2018.
That good news had to be balanced in Asia Friday with a gloomy assessment for 2020 from the International Energy Agency Thursday. It forecast that supply would outstrip demand even if the Organization of Petroleum Exporting Countries’ and Russia comply fully with output cuts.
| Change in | Longs | Shorts | OI |
| Daily | -1% | 3% | 0% |
| Weekly | 13% | -25% | -1% |
Gold Retains Strong Overall Support
Gold prices rose slightly through the session, even as most stock markets posted gains. Gold has certainly retreated markedly from the peaks seen earlier this month when a lethal US air strike killed a top Iranian general in Baghdad. However there seems no huge inclination to cash out even as markets hover near the highest point of 2019.
One hundred senators were sworn in on Thursday ahead of the impeachment trial of President Trump on charges brought by the House of Representatives. This heightened US political risk may well be supporting the gold market and dissuading investors at large from straying too far from haven assets.
Crude Oil Technical Analysis
Crude oil’s weekly chart clearly shows the damage done to prices by the removal of Iran-related risk premium.
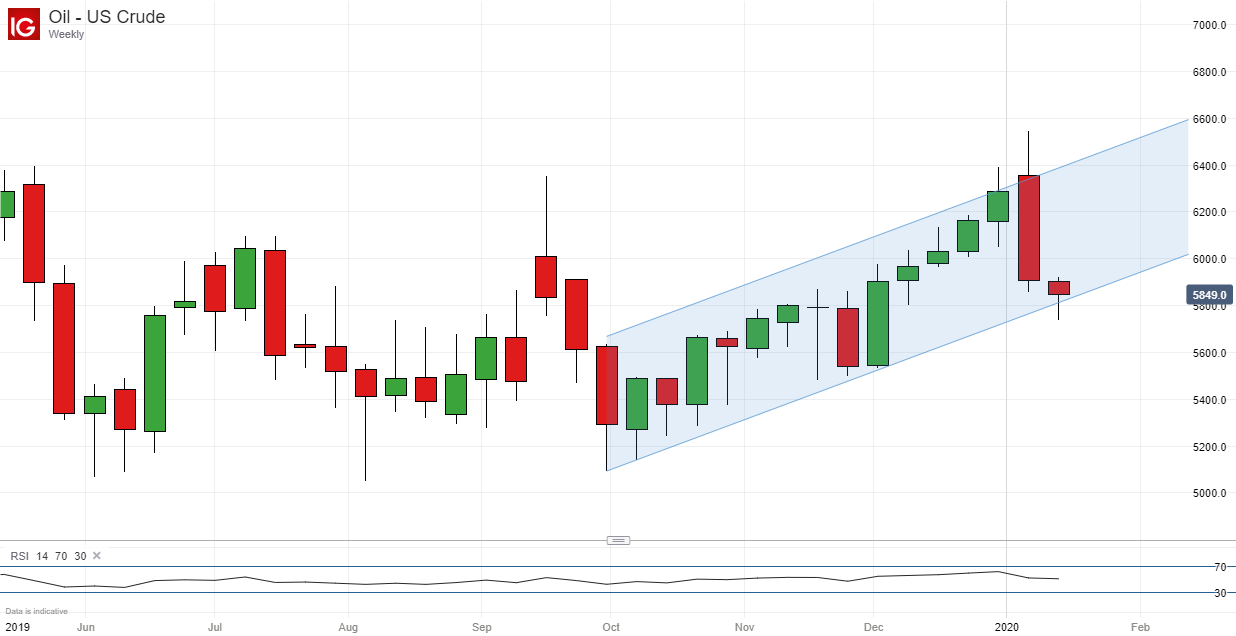
The sharp fall seen last week has put the quite remarkable sequence of gains seen since October in doubt once again and threatened channel support. It seems a little strange perhaps that the market has not returned to the upbeat tone seen before the Iran crisis erupted, but those worries about oversupply may be forcing a little rethink in any case.
Friday’s close could clearly be instructive with a breach of channel support very possible. That would put focus back on the lows of March 25 at $55.36/barrel. $58.05 is the number bulls will need to defend into this week’s end to keep channel support valid
Gold Technical Analysis
Price have exhibited a succession of quite narrow daily ranges for the last eight sessions.

This could simply be a sign of consolidation after the very wide fluctuations seen on January 7 and 8, in which case they might be quite a bullish signal. Consolidation is after all taking place close to levels not previously seen for nearly seven years.
However, those narrow ranges could also indicate fundamental indecision and, perhaps, a lack of appetite to try and chase prices any higher. The most obvious near-term directional clue will probably come with a break either way of the current modest trading range.
| Change in | Longs | Shorts | OI |
| Daily | -3% | 11% | 4% |
| Weekly | -1% | -5% | -3% |
Commodity Trading Resources
- See our guide to learn about the long-term forces driving crude oil prices
- Having trouble with your strategy? Here’s the #1 mistake that traders make
- Join a free webinar and have your commodity market questions answered
--- Written by David Cottle, DailyFX Research
Follow David on Twitter @DavidCottleFX or use the Comments section below to get in touch!


