


GOLD & CRUDE OIL TALKING POINTS:
- Gold prices stabilize, could rise as bond yields fall in risk-off trade
- Markets on the defensive before FOMC, UK election, US tariff hike
- Crude oil price chart warns a reversal lower might be in the cards
Gold prices stabilized at the start of the new week after Friday’s slump in the wake of November’s US jobs data. The metal is attempting to find its way higher early Tuesday as bond yields fall alongside bellwether S&P 500 futures, boosting the appeal of non-interest-bearing alternatives against a risk-off backdrop. Cycle-sensitive crude oil prices are also under pressure having been were similarly staid yesterday.
The defensive mood probably reflects protective pre-positioning ahead of the week’s top-tier event risk. Much of the past four months have been characterized by firming confidence amid hopes that a “phase one” US-China trade deal will be signed and a no-deal Brexit avoided. These assumptions will be challenged in the days ahead, which may explain traders’ desire to rebalance exposure closer toward neutral.
On trade, a wary FOMC may dilute some of last month’s optimism about receding risk as relations between Washington and Beijing turn frostier. Further, the US is still set for more tariffs hikes this weekend (at least for now). Meanwhile, markets may be wondering if a Conservative majority after this week’s UK election will ensure passage of the government’s Brexit deal. Its predecessor’s example warns it may not.
Turning to the economic calendar, the EIA Short-Term Energy Outlook report will offer an updated set of US output forecasts while weekly API inventory data will foreshadow what might be expected from official figures Wednesday. It will be weighed up against economists’ expectations calling for a 2.82-million-barrel outflow, marking the second consecutive week of drawdown.
GOLD TECHNICAL ANALYSIS
Gold prices continue to hover within the bounds of what looks like a bullish Falling Wedge chart pattern. Confirmation of the setup on a daily close above its upper boundary – now at 1489.78 – initially targets the 1516.05-23.05 area. Alternatively, a drop under support wedge support at 1429.91 may clear a path below the $1400/oz figure.

Gold price chart created using TradingView
CRUDE OIL TECHNICAL ANALYSIS
Crude oil prices are testing resistance in the 60.04-84 area, with negative RSI divergence warning that upside momentum is ebbing. A turn lower from here that takes out upward-sloping support set from the October 3 low – now at 55.77 – exposes the range floor in the 50.52-51.00 zone. Alternatively, a breach of resistance aims for the September 16 swing high at 63.38.
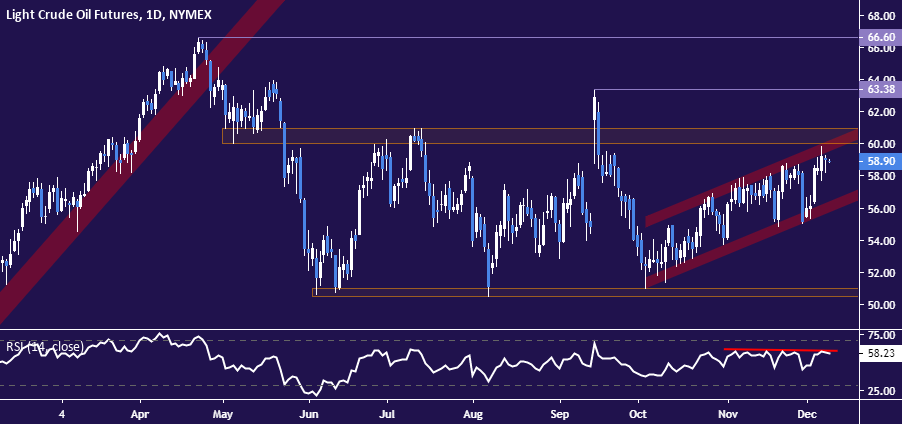
Crude oil price chart created using TradingView
COMMODITY TRADING RESOURCES
- See our guide to learn about the long-term forces driving crude oil prices
- Having trouble with your strategy? Here’s the #1 mistake that traders make
- Join a free webinar and have your commodity market questions answered
--- Written by Ilya Spivak, Currency Strategist for DailyFX.com
To contact Ilya, use the comments section below or @IlyaSpivak on Twitter


