


Gold and Crude Oil Talking Points:
- Gold prices backed up from three-month lows as risk appetite took a new hit, with stock markets broadly lower
- UK growth data might revive that appetite if the country is proven to have escaped recession
- Crude oil prices also slipped back, but growth data could support those too
Join our analysts for live, interactive coverage of all major economic data at the DailyFX Webinars. We’d love to have you along.
Gold prices inched up a little from the three-month lows hit last week as continued unrest in Hong Kong gave risk appetite pause.
The Hang Seng index there fell more than 2% on the news that the police had opened fire at mass demonstrations on Monday, injuring at least two protestors. Pro-democracy lawmarkets were arrested over the weekend.
Gold and other haven assets had been pressured last week by signs of improved trade relations between China and the US, but the story remains very fluid. Both sides appear to be working toward what they call a ‘phase one’ or interim trade deal.
The day’s main predictable risk event could be official UK Gross Domestic Product data. The country remains in the thrall of campaigning for next month’s general election, with Brexit of course the main focus. However, growth is expected to have resumed in the third quarter, after contracting in the second. If so there may be a relief rally and more pressure on haven assets like gold.
Crude oil prices gained last week on trade optimism despite news of significant US inventory building and worries about likely demand levels ahead. However, prices have fallen back on Monday as risk appetite has retreated. This market will look to this week’s growth data from both the UK and Japan for clues, and also to further US inventory numbers due on November 15.
Gold Technical Analysis
The main downtrend channel from September 5 remains dominant over price action, despite a modest hiatus in price falls over the past couple of days.
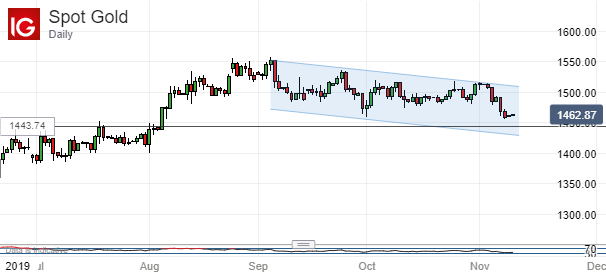
Prices appear to be sliding toward $1443.74/ounce. That’s the second, 38.2% Fibonacci retracement of the rise up from August’s lows to the peaks of September and seems likely to face a retest within the next few days.
Crude Oil Technical Analysis.
Spot prices remain in the medium-term uptrend established on the daily chart back in early October.
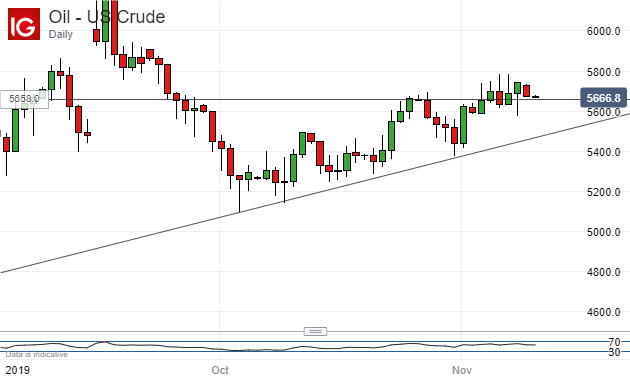
The price has also made a new, higher high by topping the peaks of October 25. However, it has yet to do so entirely convincingly on a daily closing basis and may be showing signs of tiring back toward that point. Keep a close eye on the $56.58/barrel area which seems to be exerting a pull on prices.
Commodity Trading Resources
- See our guide to learn about the long-term forces driving crude oil prices
- Having trouble with your strategy? Here’s the #1 mistake that traders make
- Join a free webinar and have your commodity market questions answered
--- Written by David Cottle, DailyFX Research
Follow David on Twitter @DavidCottleFX or use the Comments section below to get in touch!


