


CRUDE OIL & GOLD TALKING POINTS:
- Crude oil prices shrug off EIA data, eyeing Tropical Storm Nestor
- Gold prices unmoved by Brexit deal as UK parliament vote looms
- De-risking may ensue as investors trim exposure before weekend
Crude oil prices shrugged off EIA data showing inventories added a hefty 9.28 million barrels last week, topping forecasts calling for a more modest 2.49 million rise. The outcome may have been priced in already courtesy of a leading projection from API, sapping its market-moving potential.
Worries about supply disruption in the Gulf of Mexico then seemed to inspire a tepid rise into the session close. Gains were accompanied by reports that Tropical Storm Nestor was taking shape along Mexico’s east coast and might begin to threaten US energy infrastructure over the weekend.
Gold prices stalled in the meanwhile. The metal edged initially lower as the UK and EU agreed on a Brexit deal but the move was short-lived as markets pondered its practical viability. The accord may be made moot if it can’t get passed in the UK parliament, where opposition from the DUP maymean certain doom.
CRUDE OIL MAY FALL AS MARKETS TURN DEFENSIVE INTO WEEK-END
Looking ahead, a quiet data docket might clear the way for a pullback in sentiment-linked assets as shorter-term market participants mitigate weekend risk. Much can happen – from a rejection of the Brexit deal by UK MPs to the unraveling of US-China trade talks – before the APAC opening bell on Monday.
With that in mind, traders might move to bring portfolios closer to neutral. In the context of broadly risk-on tilt on display thus far this week, that might amount to weakness for cycle-sensitive crude oil. Gold prices could edge up if a defensive backdrop translates into lower bond yields.
Get our free guide to help build confidence in your gold and crude oil trading strategy !
GOLD TECHNICAL ANALYSIS
Gold prices broke support guiding them higher since late May. It is unclear at this point whether the subsequent choppy pullback marks a slow start to an emerging downtrend or the formation of a bullish Flag continuation pattern. A daily close below 1480.00 exposes the 1439.14-46.94 area. Alternatively, a push above resistance at 1535.03 targets the 1557.10-63.00 zone (September high, weekly chart inflection level).

Gold price chart created using TradingView
CRUDE OIL TECHNICAL ANALYSIS
Crude oil prices are marking time above range support in the 49.41-50.60 area. A break downward confirmed on a daily closing basis brings three-year lows in the 42.00-43.00 region into view. Alternatively, a push above October 11 high at 54.93 sets the stage to challenge a busy resistance bloc extending up through 60.84.
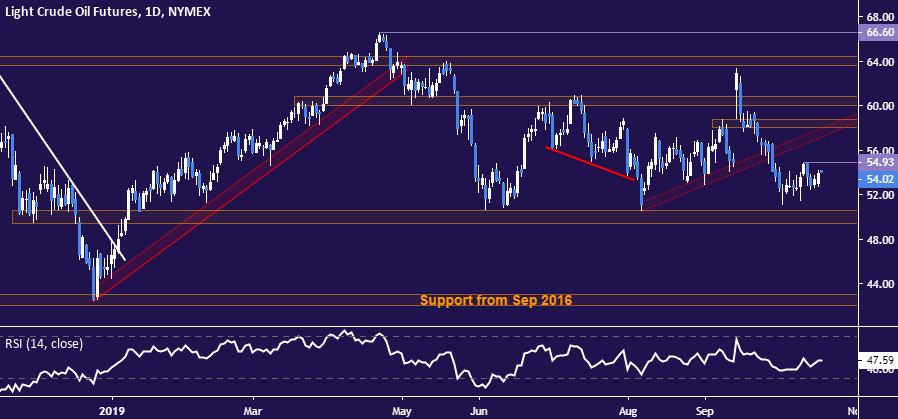
Crude oil price chart created using TradingView
COMMODITY TRADING RESOURCES
- See our guide to learn about the long-term forces driving crude oil prices
- Having trouble with your strategy? Here’s the #1 mistake that traders make
- Join a free webinar and have your commodity market questions answered
--- Written by Ilya Spivak, Currency Strategist for DailyFX.com
To contact Ilya, use the comments section below or @IlyaSpivak on Twitter


