


GOLD & CRUDE OIL TALKING POINTS:
- Gold prices up on soft US retail sales, fizzling Brexit deal hopes
- DUP rejects Brexit deal emerging ahead of EU leaders’ summit
- Crude oil prices may fall as EIA data bolsters risk-off weakness
Gold prices edged higher as soft US retail sales data triggered a dovish shift in priced-in Fed policy bets, weighing on the US Dollar and boosting the relative appeal of anti-fiat alternatives. Crude oil prices finished the day little changed. A shallow intraday upswing fizzled as API said it expects US inventories to have added a hefty 10.5 million barrels last week.
GOLD PRICES UP AS DUP REJECTS EMERGING EU/UK BREXIT DEAL
Looking ahead, a much-anticipated EU leaders’ summit is in focus. Speculation that the gathering might conclude in a Brexit deal has markets parsing every bit of headline flow from the gathering. The mood is broadly defensive before anything definitive has been done however after the DUP party – a kingmaker in the UK Parliament – said it will not support it, making any agreement stillborn.
Gold is up as yields fall alongside stock index futures in risk-off trade, the anti-risk JPY and USD are on the upswing and the British Pound is tellingly sinking against an average of its major counterparts. Crude oil is managing to deflect selling pressure for now but may succumb if the risk-off push gathers steam. EIA inventory data re-confirming a large inflow last week may amplify weakness.
Get our free guide to help build confidence in your gold and crude oil trading strategy !
GOLD TECHNICAL ANALYSIS
Gold prices are idling in familiar territory as sellers struggle to make good on a choppy Head and Shoulders top. A daily close below the 1480-84.63 area might bring a pickup in momentum, exposing the 1439.14-46.94 zone next. Alternatively, pushing above the 1520.34-35.03 region sets the stage to challenge 1563.00.
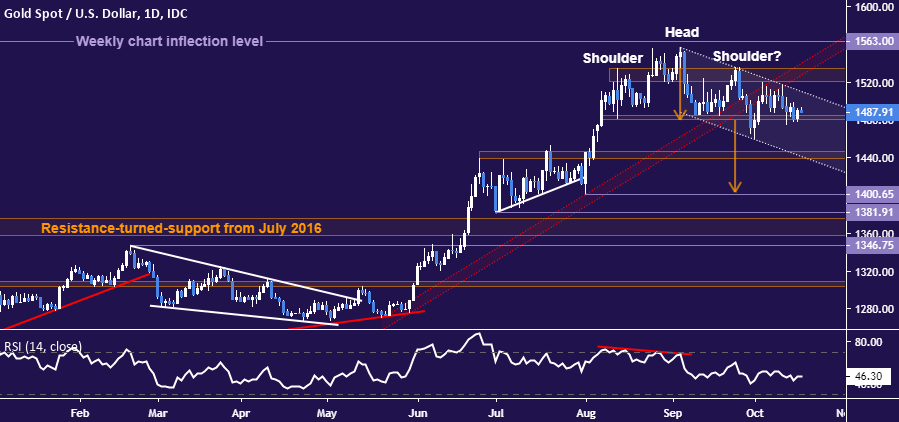
Gold price chart created using TradingView
CRUDE OIL TECHNICAL ANALYSIS
Crude oil prices are treading water above range support in the 49.41-50.60 area. A daily close below that puts three-year lows in the 42.00-43.00 zone into focus. Alternatively, a rebound back above the October 11 high at 54.93 brings into view clustered resistance levels running up through 60.84.

Crude oil price chart created using TradingView
COMMODITY TRADING RESOURCES
- See our guide to learn about the long-term forces driving crude oil prices
- Having trouble with your strategy? Here’s the #1 mistake that traders make
- Join a free webinar and have your commodity market questions answered
--- Written by Ilya Spivak, Currency Strategist for DailyFX.com
To contact Ilya, use the comments section below or @IlyaSpivak on Twitter


