


CRUDE OIL & GOLD TALKING POINTS:
- Crude oil prices pressured as US-China trade talks wobble
- Gold prices edge higher, but H&S topping pattern still eyed
- ECB President Draghi, US PMI data may sour risk appetite
Sign of trouble in US-China trade talks spooked financial markets and cooled risk appetite Friday, sending cycle-sensitive crude oil prices lower alongside stocks. Gold prices rose as the defensive mood weighed on bond yields, boosting the relative appeal of non-interest-bearing assets.
Looking ahead, downbeat comments from ECB President Mario Draghi may reinforce concerns about slowing global growth. That may be followed by better-than-expected US PMI data. News-flow from the world’s largest economy has tended to outperform relative to baseline forecasts recently.
Taken together, this might bolster investors’ confidence in the need for further policy accommodation even as it cools Fed easing prospects, amounting to a broadly risk-off tilt. Crude oil may continue to suffer against this backdrop. Gold may not capitalize however if fears of higher rates are the catalyst at work.
Get our free guide to help build confidence in your gold and crude oil trading strategy !
GOLD TECHNICAL ANALYSIS
Gold prices may be forming a bearish Head and Shoulders (H&S) top. Confirming the setup on a daily close below 1480 would imply a measured target near $1400/oz, with support in the 1437.70-52.95 noted along the way. An upturn through resistance at 1523.05 aims for the weekly chart inflection level at 1563.00.
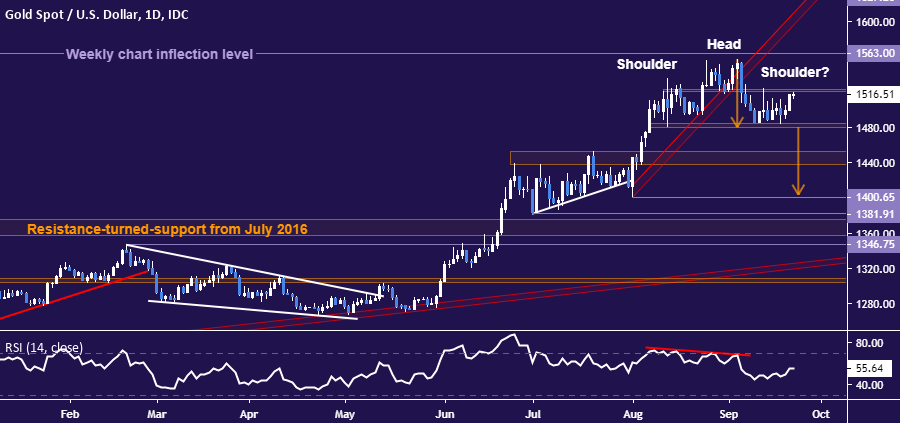
Gold price chart created using TradingView
CRUDE OIL TECHNICAL ANALYSIS
Crude oil prices pulled back from last week’s explosive rally to settle at resistance-turned-support in the 58.03-76 area. A daily close below that paves the way to challenge support guiding prices higher from August lows, now at 54.71. Alternatively, a move back above 60.84 puts April’s swing high at 66.60 back in focus.

Crude oil price chart created using TradingView
COMMODITY TRADING RESOURCES
- See our guide to learn about the long-term forces driving crude oil prices
- Having trouble with your strategy? Here’s the #1 mistake that traders make
- Join a free webinar and have your commodity market questions answered
--- Written by Ilya Spivak, Currency Strategist for DailyFX.com
To contact Ilya, use the comments section below or @IlyaSpivak on Twitter


