


Crude oil, gold price performance chart created using TradingView
CRUDE OIL & GOLD TALKING POINTS:
- Crude oil prices rise as Iran rebuffs Trump overture, inventories surge
- Gold prices edge past resistance, might move to test six-year resistance
- Political instability, trade war jitters may cap any pro-risk price moves
Crude oil prices broke with an otherwise defensive mood on global financial markets, scoring the largest daily increase in a week. OPEC+ producers said they expect to deplete the surplus in global stockpiles in the second half of the year, Iran rebuffed an olive branch from US President Trump – saying sanctions must be eased to commence talks – and API data showed inventories shed 11.1 million barrels last week.
Gold prices were pulled into broader risk-off dynamics however. The epitome for non-interest-bearing assets found relative support as bond yields fell. The mood around financial markets soured as China cast doubt on reports that it initiated a reboot of trade negotiations with the US while recession fears were stoked by a deeper inversion of the Treasuries yield curve.
CRUDE OIL PRICES MAY STRUGGLE TO RISE IN BROADLY JITTERY MARKETS
Looking ahead, a quiet day on the economic data front is likely to put sentiment trends back at the forefront. Bellwether S&P 500 futures are pointing higher to suggest a cautiously risk-on tilt, but durable follow-through in this direction seems inherently unlikely considering the extent of vulnerability to headline risk endemic to the current environment.
Indeed, a stray comment from either Washington or Beijing fanning the flames of trade war, a tense exchange between the White House and officials in Tehran, or an unexpected outturn in the Brexit saga might spoil the mood at a moment’s notice. This means that investors are probably more defensive in general, diminishing scope for any substantive pro-risk trend development as a matter of course.
Get our free guide to help build confidence in your gold and crude oil trading strategy !
GOLD TECHNICAL ANALYSIS
Gold prices pushed through resistance marked by the August 13 high at 1535.03, seemingly setting the stage for a challenge of the weekly chart inflection level at 1563.00. Still, negative RSI divergence warns of ebbing upside momentum. A daily close back below 1535.03 initially targets 1480.00 next.
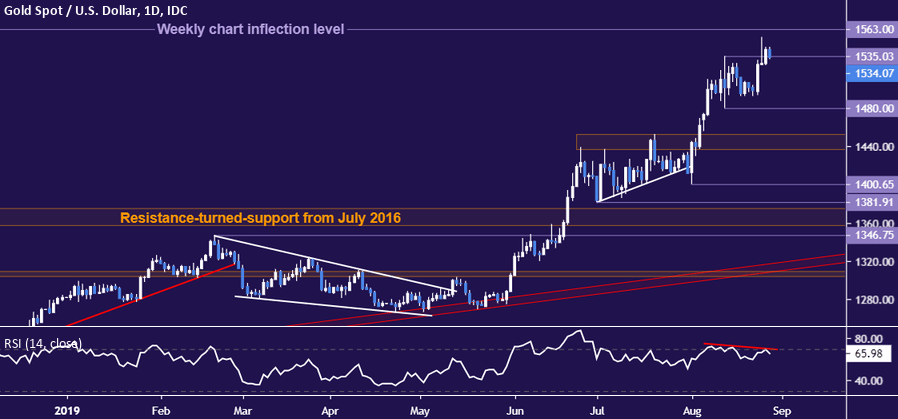
Gold price chart created using TradingView
CRUDE OIL TECHNICAL ANALYSIS
Crude oil prices bounced back toward resistance at a downward-sloping barrier capping gains since late April, now at 57.72. A daily close above that opens the door to challenge of the 60.04-84 zone. Alternatively, a move below the August 26 low at 52.96 targets sets the stage to retest support near the $50/bbl figure.

Crude oil price chart created using TradingView
COMMODITY TRADING RESOURCES
- See our guide to learn about the long-term forces driving crude oil prices
- Having trouble with your strategy? Here’s the #1 mistake that traders make
- Join a free webinar and have your commodity market questions answered
--- Written by Ilya Spivak, Currency Strategist for DailyFX.com
To contact Ilya, use the comments section below or @IlyaSpivak on Twitter


