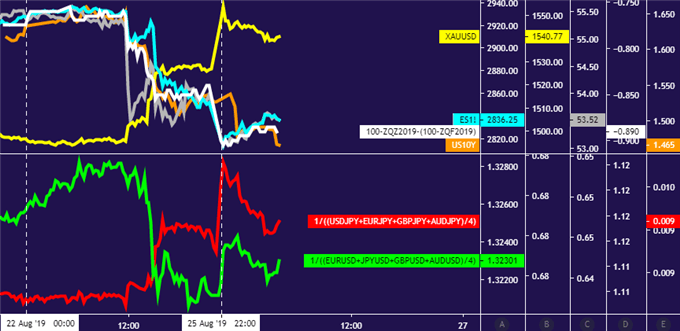
Crude oil, gold price performance chart created using TradingView
CRUDE OIL & GOLD TALKING POINTS:
- Crude oil prices gap lower as US-China trade war escalates
- Gold prices set 2019 high as bond yields fall in risk-off trade
- S&P 500 futures hint markets to remain in a defensive mood
Cycle-sensitive crude oil prices plunged alongside stocks on Friday as the US-China trade war escalated, with Beijing and Washington exchanging back-to-back announcements of further tariff hikes mere hours apart. Further disruption of the trade route between two of the world’s largest economies understandably amplified global slowdown fears.
The defensive mood pushed capital toward haven and otherwise anti-risk assets, boosting demand for Treasury bonds and weighing on yields. The turmoil likewise encouraged Fed rate cut speculation, compounding the slide in borrowing costs. Not surprisingly, that offered relative support to non-interest-bearing alternatives, pushing gold prices convincingly upward.
More if the same was on display in Asia Pacific trading hours, with follow-through seemingly likely in the hours ahead. Indeed, bellwether S&P 500 futures are pointing ominously lower, signaling that liquidation aims to continue as bourses in Europe and North America come online. Diminished liquidity might amplify kneejerk volatility as markets in the UK remain shuttered for a bank holiday.
Get our free guide to help build confidence in your gold and crude oil trading strategy !
GOLD TECHNICAL ANALYSIS
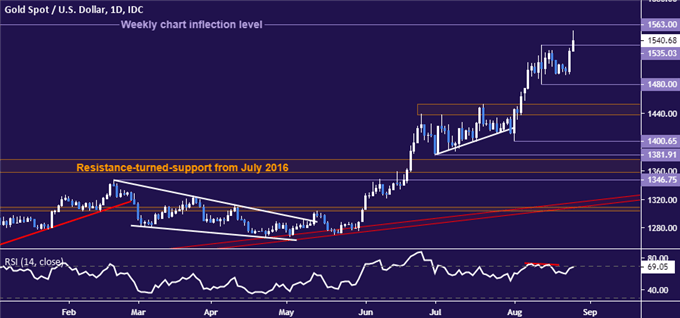
Gold prices are probing above the August 13 swing high at 1353.03. Confirmation of a break on a daily closing basis opens the door to test a weekly chart inflection level at 1563.00. Alternatively, a move back below immediate resistance sees initial support at 1480.00.

Gold price chart created using TradingView
CRUDE OIL TECHNICAL ANALYSIS
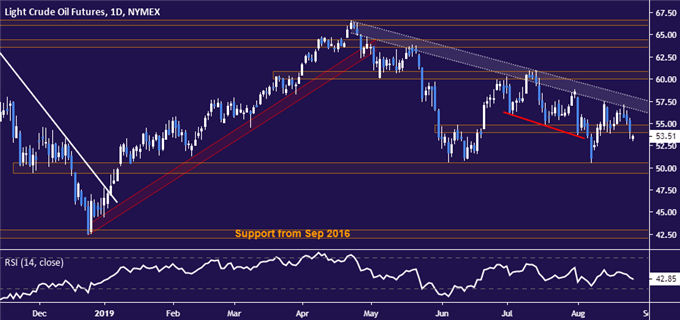
Crude oil prices gapped below support in the 53.95-54.84 congestion area. Confirmation of a break on a daily closing basis sets the stage to challenge the next downside barrier near the $50/bbl figure. Alternatively, a rebound above 54.84 initially targets falling trend resistance set from late April, now at 57.92.

Crude oil price chart created using TradingView
COMMODITY TRADING RESOURCES
- See our guide to learn about the long-term forces driving crude oil prices
- Having trouble with your strategy? Here’s the #1 mistake that traders make
- Join a free webinar and have your commodity market questions answered
--- Written by Ilya Spivak, Currency Strategist for DailyFX.com
To contact Ilya, use the comments section below or @IlyaSpivak on Twitter


