


CRUDE OIL & GOLD TALKING POINTS:
- Crude oil prices pop on US-China trade deal hopes before G20 meeting
- Gold price chart positioning still warns that a double top is in the works
- Fed rates outlook may clash with dovish market view, cool risk appetite
Hopes for a US-China trade war resolution buoyed risk appetite yesterday, sending crude oil prices higher alongside stocks and pushing gold back down from intraday highs to reverse yet another spirited upside foray. The yellow metal saw early gains as yields drifted lower amid pre-positioning for the upcoming FOMC rate decision, offering a boost to non-interest-bearing alternatives.
CRUDE OIL, GOLD PRICES MAY FALL ON FED POLICY ANNOUNCEMENT
The US central bank is expected to keep the policy mix unchanged this time around, but markets seem primed for a major dovish shift in official forecasts and the accompanying commentary. Priced-in policy bets implied in Fed Funds futures imply 2-3 cuts this year along with the already-announced end of QT balance sheet reduction. The Fed said in March that it will hold rates this year and raise them once in 2020.
Matching investors’ prognosis in June’s forecast update seems like an improbably dramatic about-face for central bank officials. To that end, markets will probably contend themselves with a more gradual dovish adjustment and rhetoric setting the stage for more of the same in subsequent meetings. Such an outcome might have little scope for volatility however, whereas a hawkish surprise could be asymmetrically potent.
If Chair Jerome Powell and company appear less-than-fully committed to a substantial stimulus boost, risk appetite is likely to suffer across trade war-weary financial markets. Crude oil is likely to fall with other growth-minded assets (like stocks) against this backdrop. Meanwhile, a parallel rise in Treasury bond yields and the US Dollar stand to weigh on gold.
Did we get it right with our crude oil and gold forecasts? Get them here to find out!
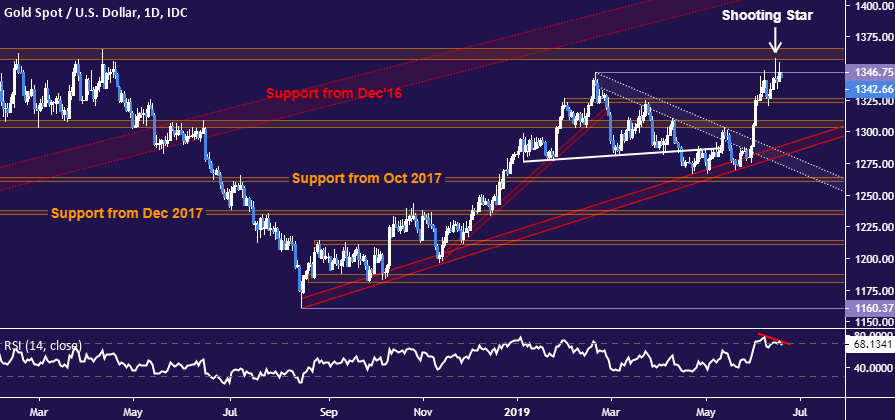
GOLD TECHNICAL ANALYSIS
A Shooting Star candlestick along with negative RSI divergence continue to suggest that gold prices are carving out a double top at resistance marked by the February’s swing top (1346.75). This is bolstered by a long-standing ceiling in the 1357.50-66.06 region. A daily close below initial support in the 1323.40-26.30 area targets the 1303.70-09.12 zone next.
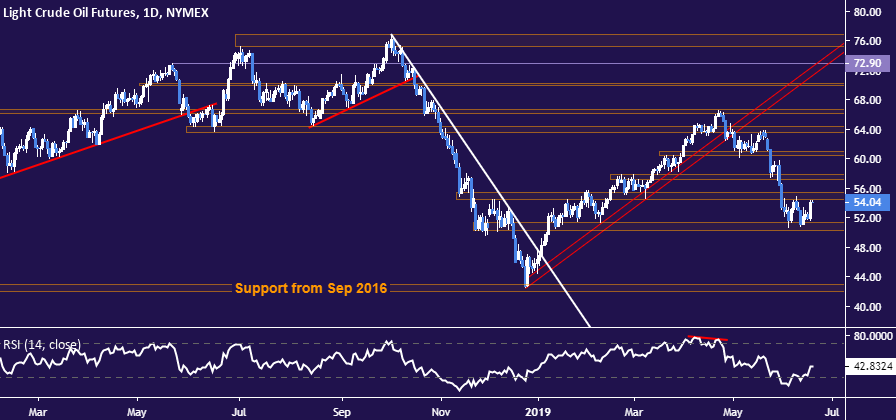
CRUDE OIL TECHNICAL ANALYSIS
Crude oil prices remain locked in a narrow range. A daily close above its top at 55.37 opens the door for a test of the 57.24-88 area. Alternatively, a break below support in the 50.31-51.33 zone targets a price floor set from September 2016 in the 42.05-43.00 zone.
COMMODITY TRADING RESOURCES
- See our guide to learn about the long-term forces driving crude oil prices
- Having trouble with your strategy? Here’s the #1 mistake that traders make
- Join a free webinar and have your commodity market questions answered
--- Written by Ilya Spivak, Currency Strategist for DailyFX.com
To contact Ilya, use the comments section below or @IlyaSpivak on Twitter


